

Question: please help with these accounting problems. Required information Problem 17-2A (Static) Ratios, common-size statements, and trend percents LO P1, P2, P3 [The following information applies
![applies to the questions displayed below.] Selected comparative financial statements of Korbin](https://s3.amazonaws.com/si.experts.images/answers/2024/07/66985fd25ffde_03366985fd1ea8cb.jpg)
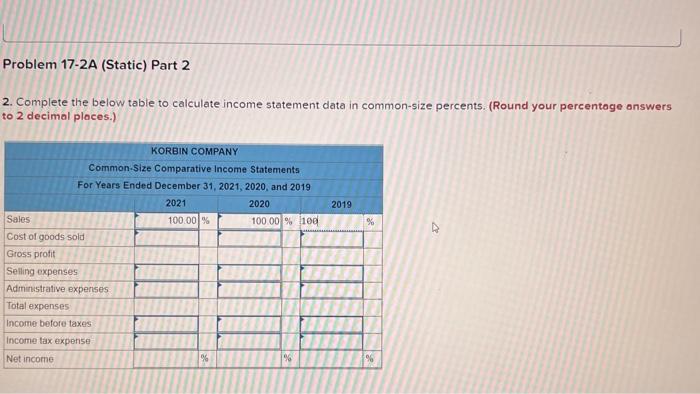
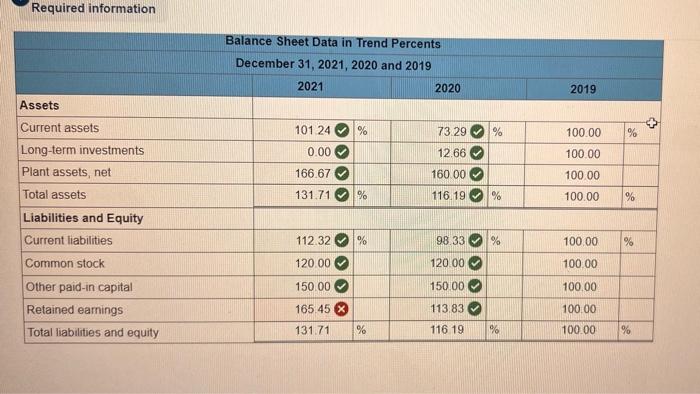
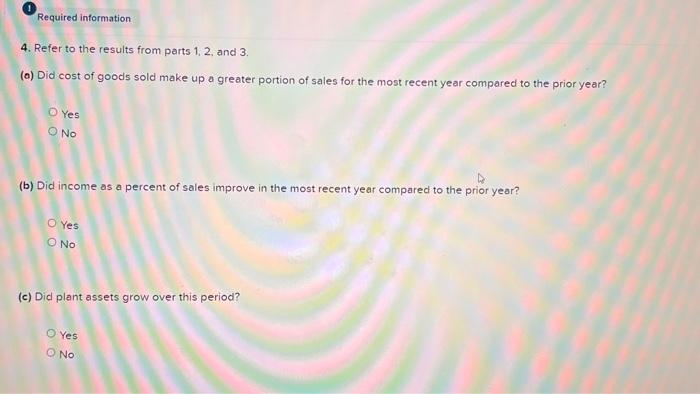
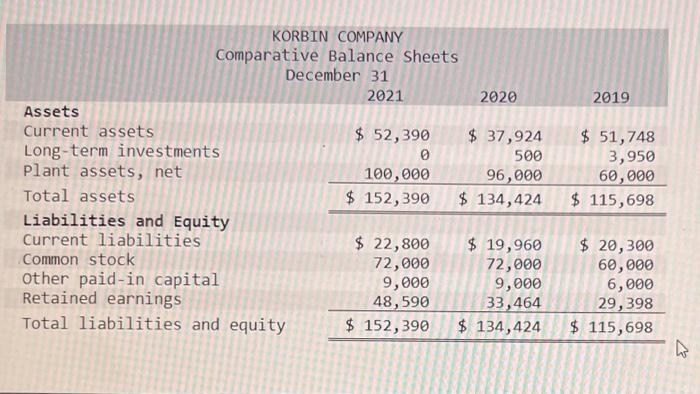
Required information Problem 17-2A (Static) Ratios, common-size statements, and trend percents LO P1, P2, P3 [The following information applies to the questions displayed below.] Selected comparative financial statements of Korbin Company follow. KORBIN COMPANY Comparative Income Statements For Years Ended December 31 2021 2020 Sales $ 555,000 $ 340,000 Cost of goods sold 283,500 212,500 Gross profit 271,500 127,500 Selling expenses 102,900 46,920 Administrative expenses 50,668 29,920 Total expenses 153,568 76,840 Income before taxes 117,932 50,660 Income tax expense 40,800 10, 370 Net income $ 77,132 $ 40,290 2019 $ 278,000 153,900 124,100 50,800 22,800 73,600 50,500 15,670 $ 34,830 2019 KORBIN COMPANY Comparative Balance Sheets December 31 2021 2020 Assets Current assets $ 52,390 $ 37,924 Long-term investments 0 500 Plant assets, net 100,000 96,000 Total assets $ 152,390 $ 134,424 Liabilities and Equity Current liabilities $ 22,800 $ 19,960 Common stock 72,000 72,000 Other paid-in capital 9,000 9,000 Retained earnings 48,590 33,464 Total liabilities and equity $ 152,390 $ 134,424 $ 51,748 3,950 60,000 $ 115,698 $ 20,300 60,000 6,000 29, 398 $ 115,698 Problem 17-2A (Static) Part 1 Required: 1. Complete the below table to calculate each year's current ratio. Answer is complete and correct. Numerator: 2021 Current Ratio Denominator: Current liabilities $ 22,800 $ 19,960 $ 20,300 V Current assets $ 52,390 37924 S 51,748 OOOO Current ratio Current ratio 23 to 1 1.9 to 1 2.5 to 1 2020 2019 V $ Problem 17-2A (Static) Part 2 2. Complete the below table to calculate income statement data in common-size percents. (Round your percentage answers to 2 decimal places.) 2019 % A KORBIN COMPANY Common.Size Comparative Income Statements For Years Ended December 31, 2021, 2020, and 2019 2021 2020 Sales 100.00% 100.00 % 100 Cost of goods sold Gross profit Selling expenses Administrative expenses Total expenses Income before taxes Income tax expense Net income %% 98 Required information Balance Sheet Data in Trend Percents December 31, 2021, 2020 and 2019 2021 2020 2019 Assets 101 24 % 73.29 % 100.00 % 0.00 12.66 100.00 Current assets Long-term investments Plant assets, net Total assets Liabilities and Equity 166.67 160 00 100.00 131.71 % 116.19 % 100.00 % % Current liabilities 112.32 % 98.33 % 100.00 % Common stock 120.00 120.00 100.00 150.00 150 00 100.00 Other paid-in capital Retained earnings Total liabilities and equity >> 165.45 131.71 113.83 116 19 100.00 100.00 % % % Required information 4. Refer to the results from parts 1, 2 and 3. (a) Did cost of goods sold make up a greater portion of sales for the most recent year compared to the prior year? O Yes O No (b) Did income as a percent of sales improve in the most recent year compared to the prior year? Yes O No (c) Did plant assets grow over this period? Yes ONO
Step by Step Solution
There are 3 Steps involved in it

Get step-by-step solutions from verified subject matter experts