

Question: please help with these from chapter 15 assignment, distribution tables at the bottom Suppose a simple random sample of size n = 150 is obtained
please help with these from chapter 15 assignment, distribution tables at the bottom
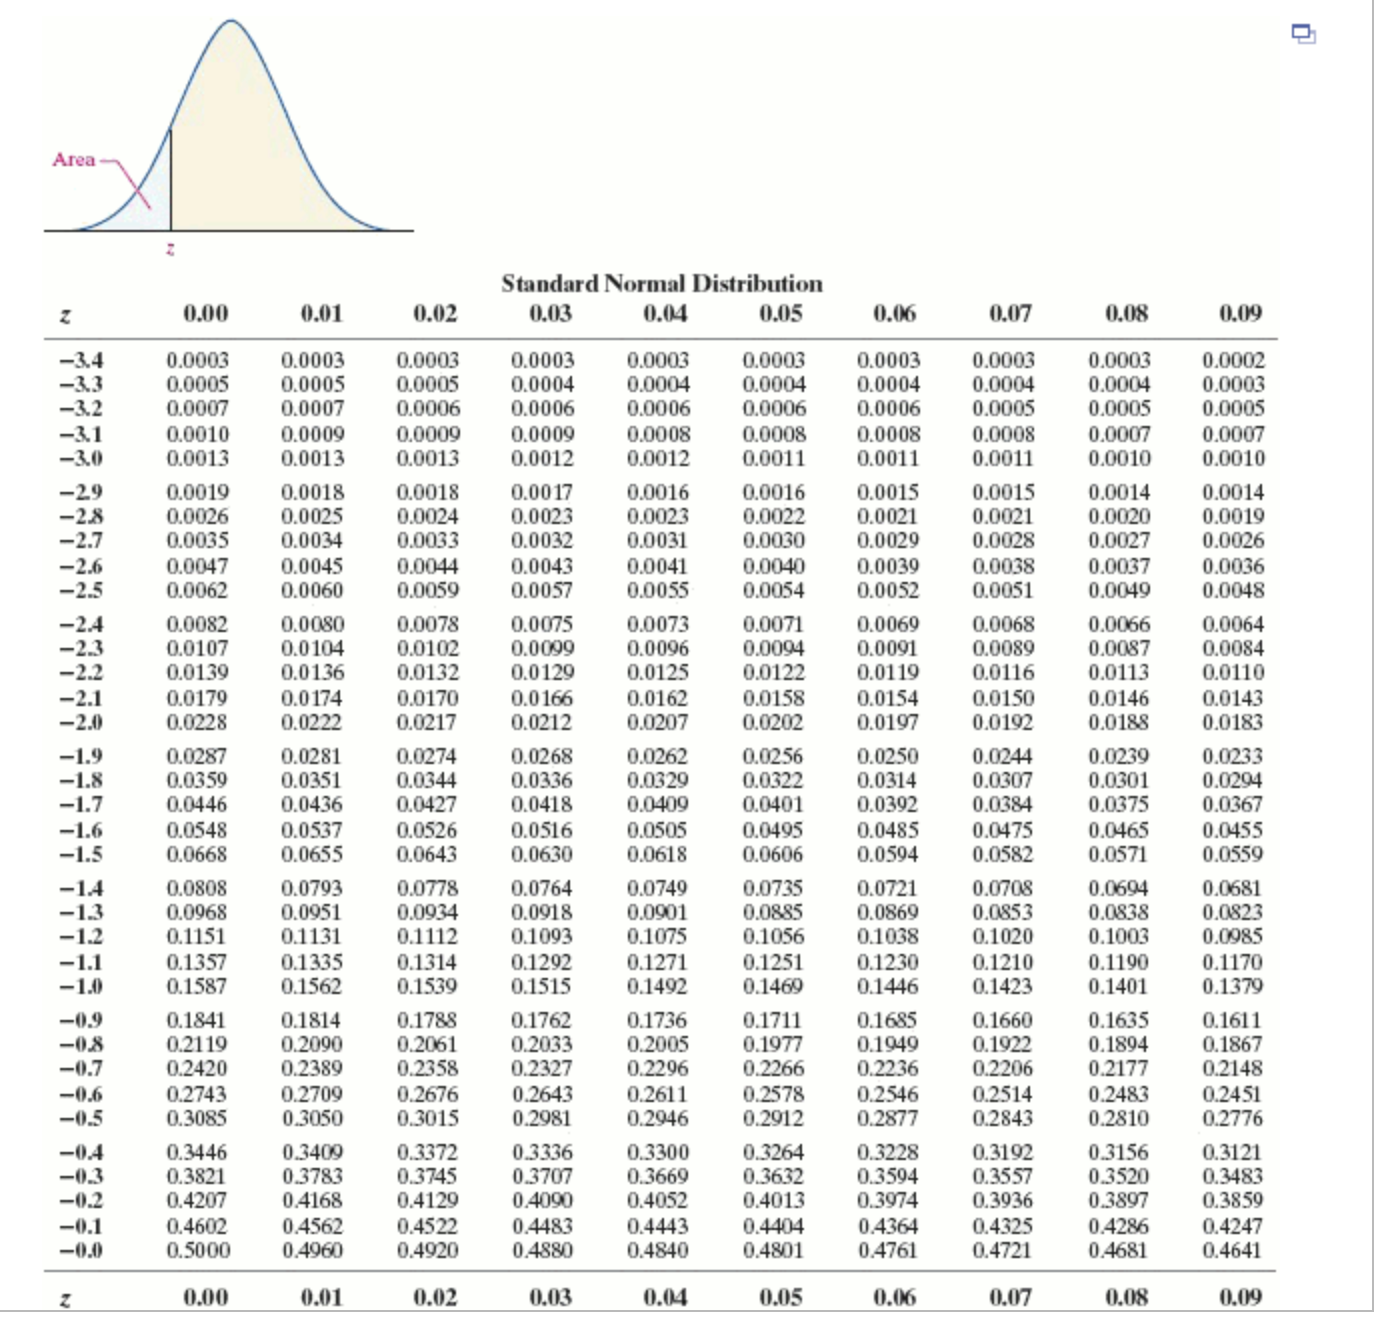
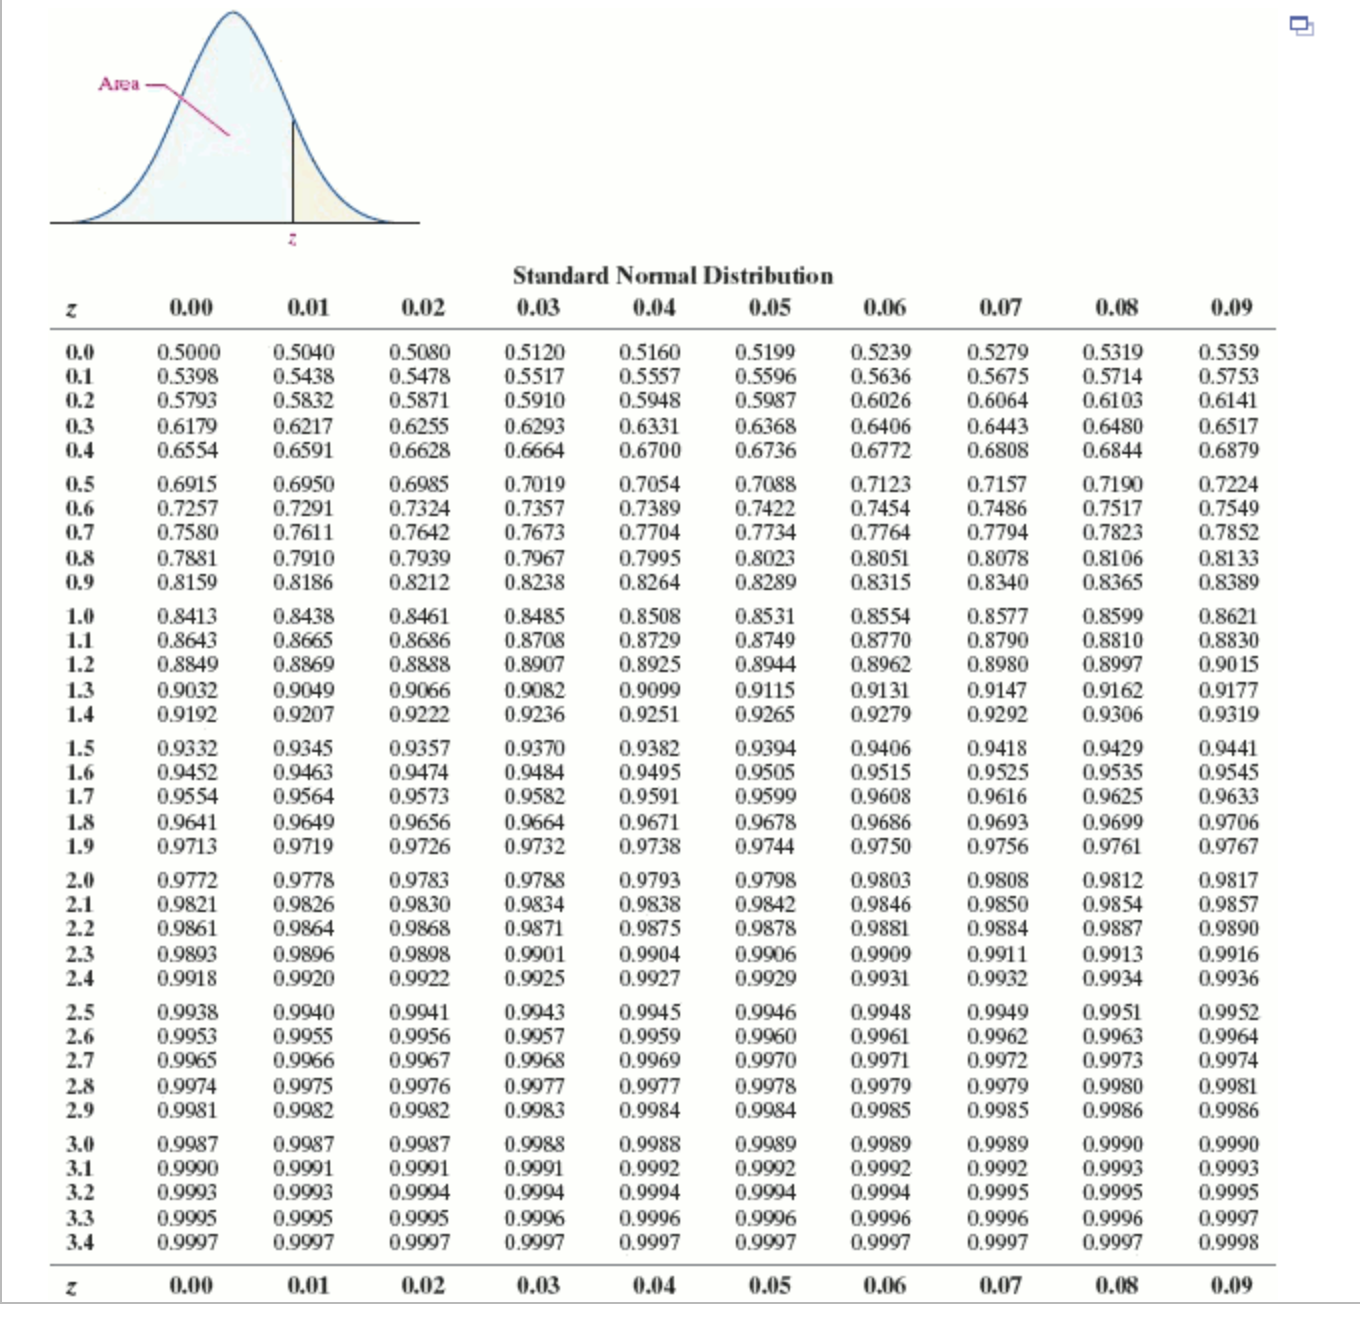
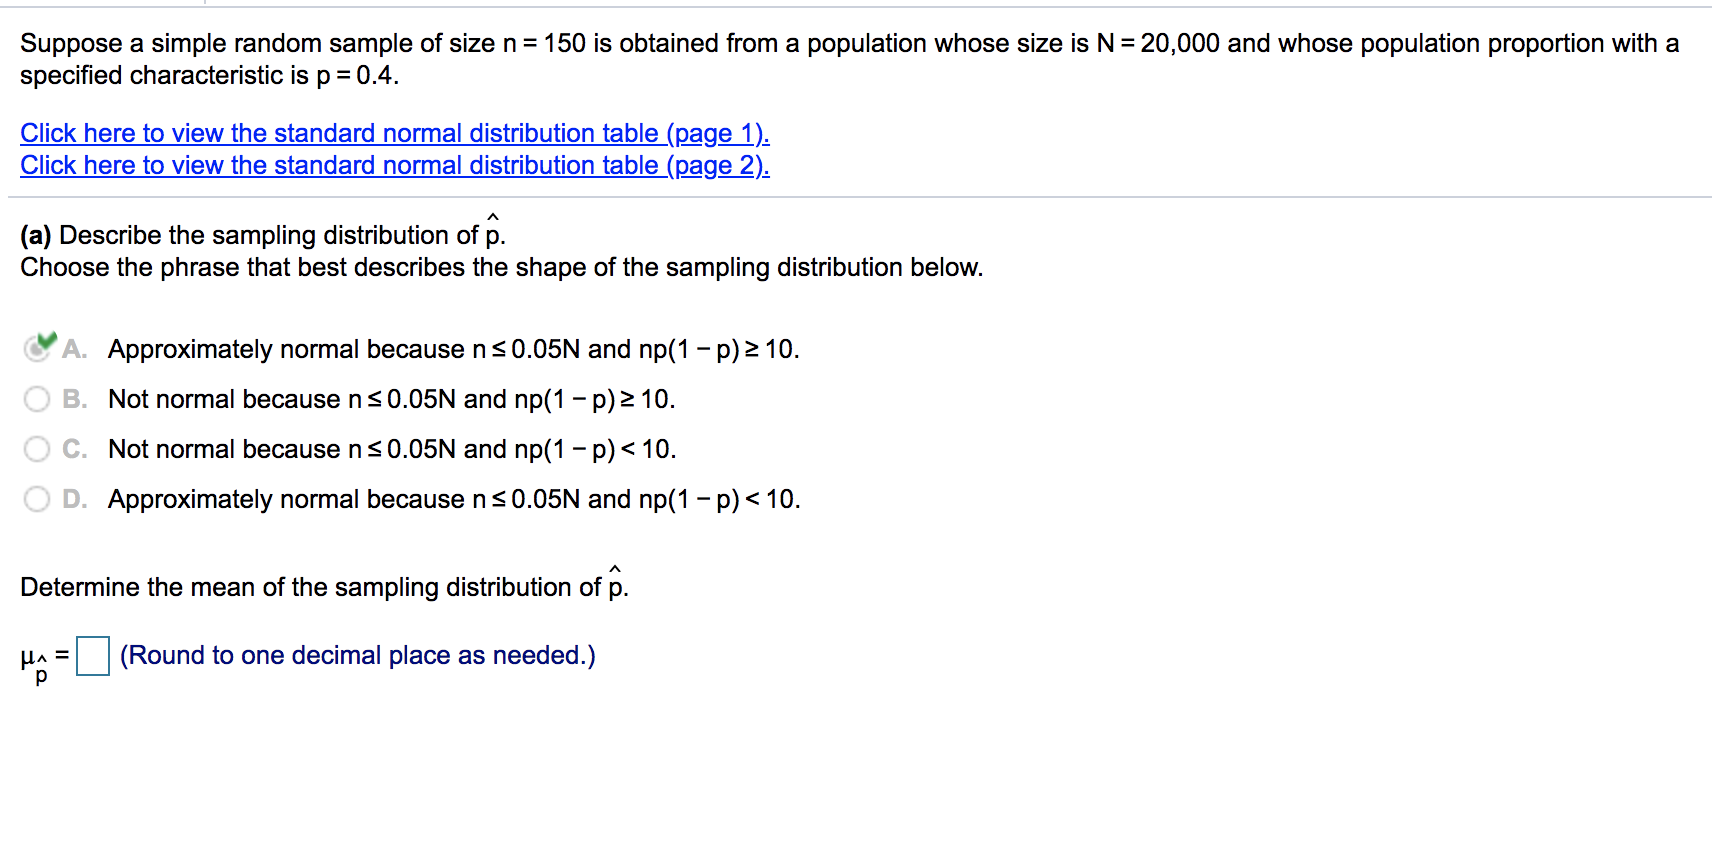
Suppose a simple random sample of size n = 150 is obtained from a population whose size is N = 20,000 and whose population proportion with a specied characteristic is p = 0.4. Click here to view the standard normal distribution table (page 1); Click here to view the standard normal distribution table (page 2); (a) Describe the sampling distribution of 6. Choose the phrase that best describes the shape of the sampling distribution below. 3 A. Approximately normal because n S 0.05N and np(1 - p)210. B. Not normal because n S 0.05N and np(1 - p) a 10. C. Not normal because n S 0.05N and np(1 - p)
Step by Step Solution
There are 3 Steps involved in it

Get step-by-step solutions from verified subject matter experts