

Question: Please help with these questions!! The graph below is a double reciprocal plot (i.e., Lineweaver Burk plot) of the WT and P237H enzymes. Answer the
Please help with these questions!! 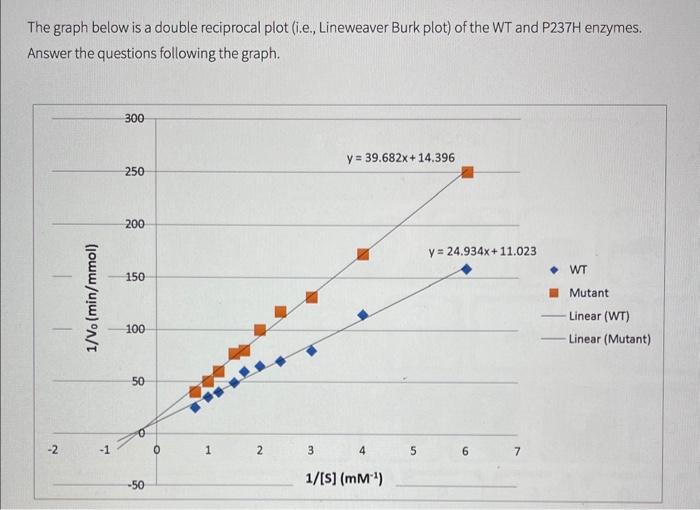


The graph below is a double reciprocal plot (i.e., Lineweaver Burk plot) of the WT and P237H enzymes. Answer the questions following the graph. What is the Vmax of the WT and P237H mutant based on the Lineweaver-Burk plot? What is the KM for the WTE and P237H mutant based on the Lineweaver-Burk plot? Given the Vmax and KM values from the Lineweaver-Burk plot, compare the function of the WT and mutant enzymes. Explain this in terms of how the two different enzymes are affecting the formation of the ES complex and the catalytic rate
Step by Step Solution
There are 3 Steps involved in it
1 Expert Approved Answer
Step: 1 Unlock

Question Has Been Solved by an Expert!
Get step-by-step solutions from verified subject matter experts
Step: 2 Unlock
Step: 3 Unlock