

Question: Please help with this and show work! Need to find the upper and lower limits for X and R charts! Refer to Table S6.1 -
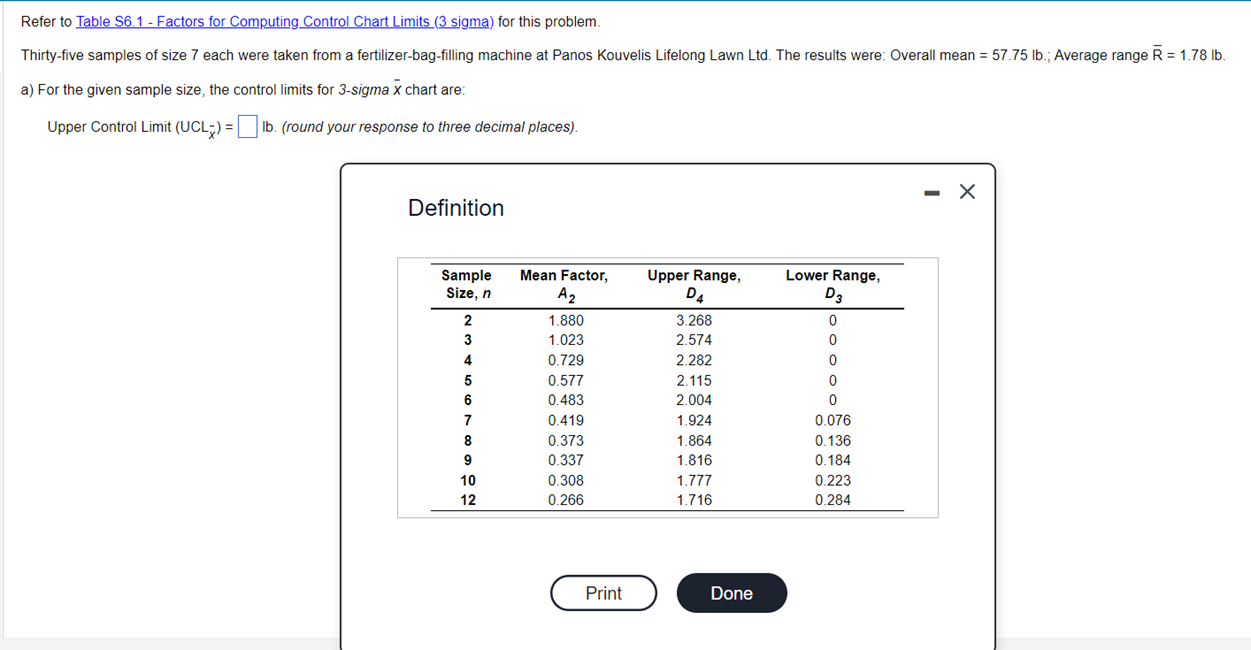 Please help with this and show work! Need to find the upper and lower limits for X and R charts!
Step by Step Solution
There are 3 Steps involved in it
1 Expert Approved Answer
Step: 1 Unlock

Question Has Been Solved by an Expert!
Get step-by-step solutions from verified subject matter experts
Step: 2 Unlock
Step: 3 Unlock