Question: Please help with this assignment. I do not have an idea how to complete it. I will rate very well no matter what. The following
Please help with this assignment. I do not have an idea how to complete it. I will rate very well no matter what.
The following is the scenario and data for assignment 1. The last photo is the filled in graph which I completed in the first assignment.
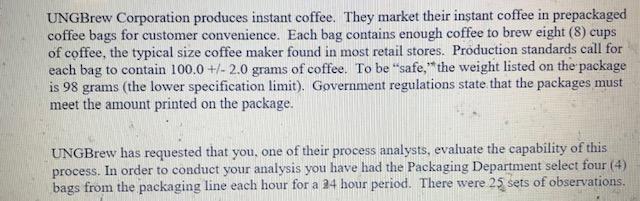
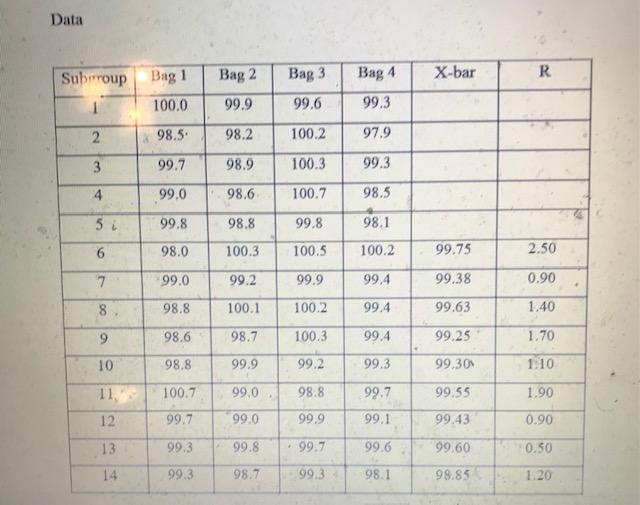
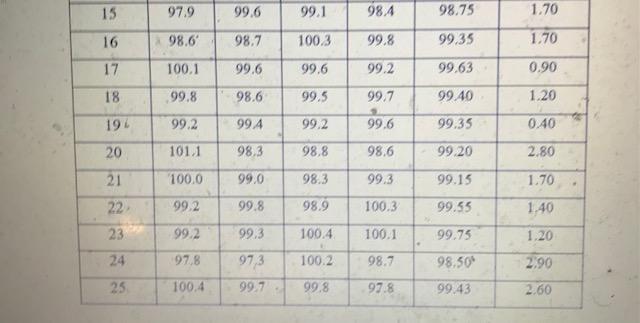
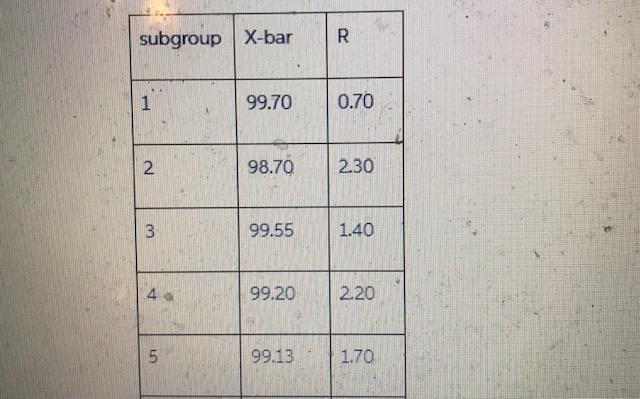
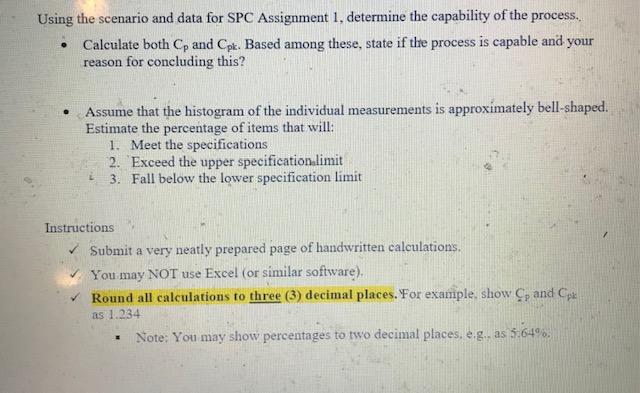
Using the scenario and data for SPC Assignment 1, determine the capability of the process. Calculate both Cp and Cpl. Based among these, state if the process is capable and your reason for concluding this? o Assume that the histogram of the individual measurements is approximately bell-shaped. Estimate the percentage of items that will: 1. Meet the specifications 2. Exceed the upper specification limit 3. Fall below the lower specification limit Instructions Submit a very neatly prepared page of handwritten calculations. You may NOT use Excel (or similar software), Round all calculations to three (3) decimal places. For example, show Cand Cpx as 1.234 Note: You may show percentages to two decimal places, eg, as 3.64% . UNGBrew Corporation produces instant coffee. They market their instant coffee in prepackaged coffee bags for customer convenience. Each bag contains enough coffee to brew eight (8) cups of coffee, the typical size coffee maker found in most retail stores. Production standards call for each bag to contain 100.0 +/- 2.0 grams of coffee. To be "safe," the weight listed on the package is 98 grams (the lower specification limit). Government regulations state that the packages must meet the amount printed on the package. UNGBrew has requested that you, one of their process analysts, evaluate the capability of this process. In order to conduct your analysis you have had the Packaging Department select four (4) bags from the packaging line each hour for a 24 hour period. There were 25 sets of observations, Data Subroup Bag 1 Bag 2 Bag 3 X-bar R Bag 4 99.3 100.0 99.9 99.6 2 98.5. 98.2 100.2 97.9 3 99.7 98.9 100.3 99.3 4 99.0 98.6 100.7 98.5 5 i 99.8 98.8 99.8 98.1 6 98.0 100.3 100.5 100.2 99.75 2.50 7 99.0 99.2 99.9 99,4 99.38 0.90 8. 98.8 100.1 100.2 99.4 99.63 1.40 9 98.6 98.7 100.3 99.4 99.25 1.70 10 98.8 99.9 99.2 99.3 99.30 1.10 11. 100.7 99.0 98.8 99.7 99,55 1.90 12 99.7 99.0 99.9 99.1 99.43 0.90 13 99.3 99.8 99.7 99.6 99.60 0.50 14 99.3 98.7 99.3 98.1 98.85 1.20 15 97.9 99.6 99.1 98.4 98.75 1.70 16 98.6 98.7 100.3 99.8 99.35 1.70 100.1 99.6 99.2 99.63 0.90 17 18 99.8 99.6 98.6 994 99.5 99.7 99.40 1.20 192 99.2 99.2 99.6 99.35 0.40 20 1011 98.3 98.8 98.6 99,20 2.80 100.0 99.0 98.3 99.3 99.15 1.70 21 22 23 99.2 99.8 98.9 100.3 99.55 1.40 99.2 100.4 100.1 99.75 1.20 99,3 97,3 24 97,8 100.2 98.7 98,50 2.90 25 100.4 99.7 99.8 97.8 99.43 2.60 subgroup X-bar R 1 1 99.70 0.70 2 98.70 2.30 3 99.55 1.40 4 99.20 2.20 5 99.13 1.70 Using the scenario and data for SPC Assignment 1, determine the capability of the process. Calculate both Cp and Cpl. Based among these, state if the process is capable and your reason for concluding this? o Assume that the histogram of the individual measurements is approximately bell-shaped. Estimate the percentage of items that will: 1. Meet the specifications 2. Exceed the upper specification limit 3. Fall below the lower specification limit Instructions Submit a very neatly prepared page of handwritten calculations. You may NOT use Excel (or similar software), Round all calculations to three (3) decimal places. For example, show Cand Cpx as 1.234 Note: You may show percentages to two decimal places, eg, as 3.64% . UNGBrew Corporation produces instant coffee. They market their instant coffee in prepackaged coffee bags for customer convenience. Each bag contains enough coffee to brew eight (8) cups of coffee, the typical size coffee maker found in most retail stores. Production standards call for each bag to contain 100.0 +/- 2.0 grams of coffee. To be "safe," the weight listed on the package is 98 grams (the lower specification limit). Government regulations state that the packages must meet the amount printed on the package. UNGBrew has requested that you, one of their process analysts, evaluate the capability of this process. In order to conduct your analysis you have had the Packaging Department select four (4) bags from the packaging line each hour for a 24 hour period. There were 25 sets of observations, Data Subroup Bag 1 Bag 2 Bag 3 X-bar R Bag 4 99.3 100.0 99.9 99.6 2 98.5. 98.2 100.2 97.9 3 99.7 98.9 100.3 99.3 4 99.0 98.6 100.7 98.5 5 i 99.8 98.8 99.8 98.1 6 98.0 100.3 100.5 100.2 99.75 2.50 7 99.0 99.2 99.9 99,4 99.38 0.90 8. 98.8 100.1 100.2 99.4 99.63 1.40 9 98.6 98.7 100.3 99.4 99.25 1.70 10 98.8 99.9 99.2 99.3 99.30 1.10 11. 100.7 99.0 98.8 99.7 99,55 1.90 12 99.7 99.0 99.9 99.1 99.43 0.90 13 99.3 99.8 99.7 99.6 99.60 0.50 14 99.3 98.7 99.3 98.1 98.85 1.20 15 97.9 99.6 99.1 98.4 98.75 1.70 16 98.6 98.7 100.3 99.8 99.35 1.70 100.1 99.6 99.2 99.63 0.90 17 18 99.8 99.6 98.6 994 99.5 99.7 99.40 1.20 192 99.2 99.2 99.6 99.35 0.40 20 1011 98.3 98.8 98.6 99,20 2.80 100.0 99.0 98.3 99.3 99.15 1.70 21 22 23 99.2 99.8 98.9 100.3 99.55 1.40 99.2 100.4 100.1 99.75 1.20 99,3 97,3 24 97,8 100.2 98.7 98,50 2.90 25 100.4 99.7 99.8 97.8 99.43 2.60 subgroup X-bar R 1 1 99.70 0.70 2 98.70 2.30 3 99.55 1.40 4 99.20 2.20 5 99.13 1.70


