

Question: The figure (Figure 1) shows voltage and current graphs for a resistor. Figure 1 VR 10 V 0+ of 1 0.00 s -10 V-
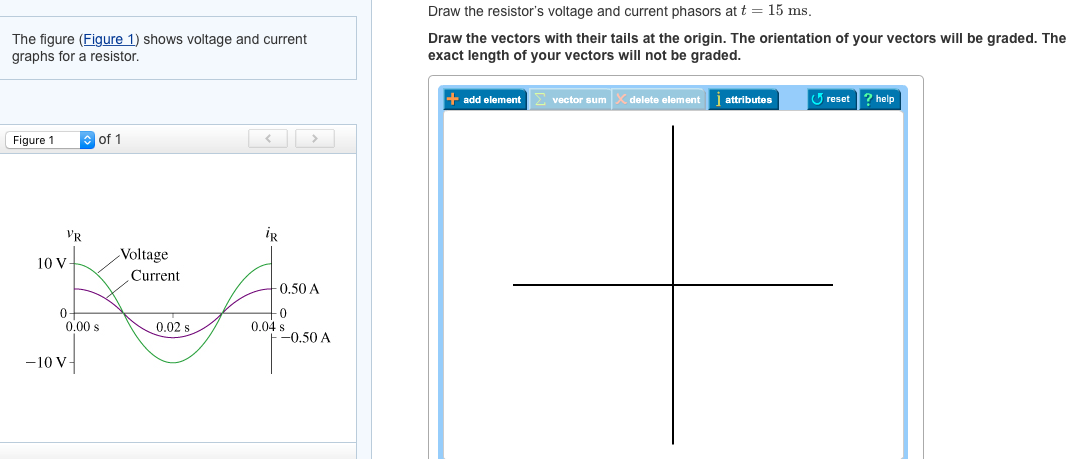
The figure (Figure 1) shows voltage and current graphs for a resistor. Figure 1 VR 10 V 0+ of 1 0.00 s -10 V- Voltage Current 0.02 s R -0.50 A -0 0.04 s --0.50 A Draw the resistor's voltage and current phasors at t = 15 ms. Draw the vectors with their tails at the origin. The orientation of your vectors will be graded. The exact length of your vectors will not be graded. add element vector sum X delete element attributes reset ? help
Step by Step Solution
3.44 Rating (170 Votes )
There are 3 Steps involved in it
Answer Time period T 004 1 frequency f 004 angular frequency 2548 W ... View full answer

Get step-by-step solutions from verified subject matter experts