

Question: View History Bookmarks Window Help ezto.mheducation.com C cs -Tableau (Please note 2 attempts ar... i Saved Hel Required information Required: la. Which Salesperson has the
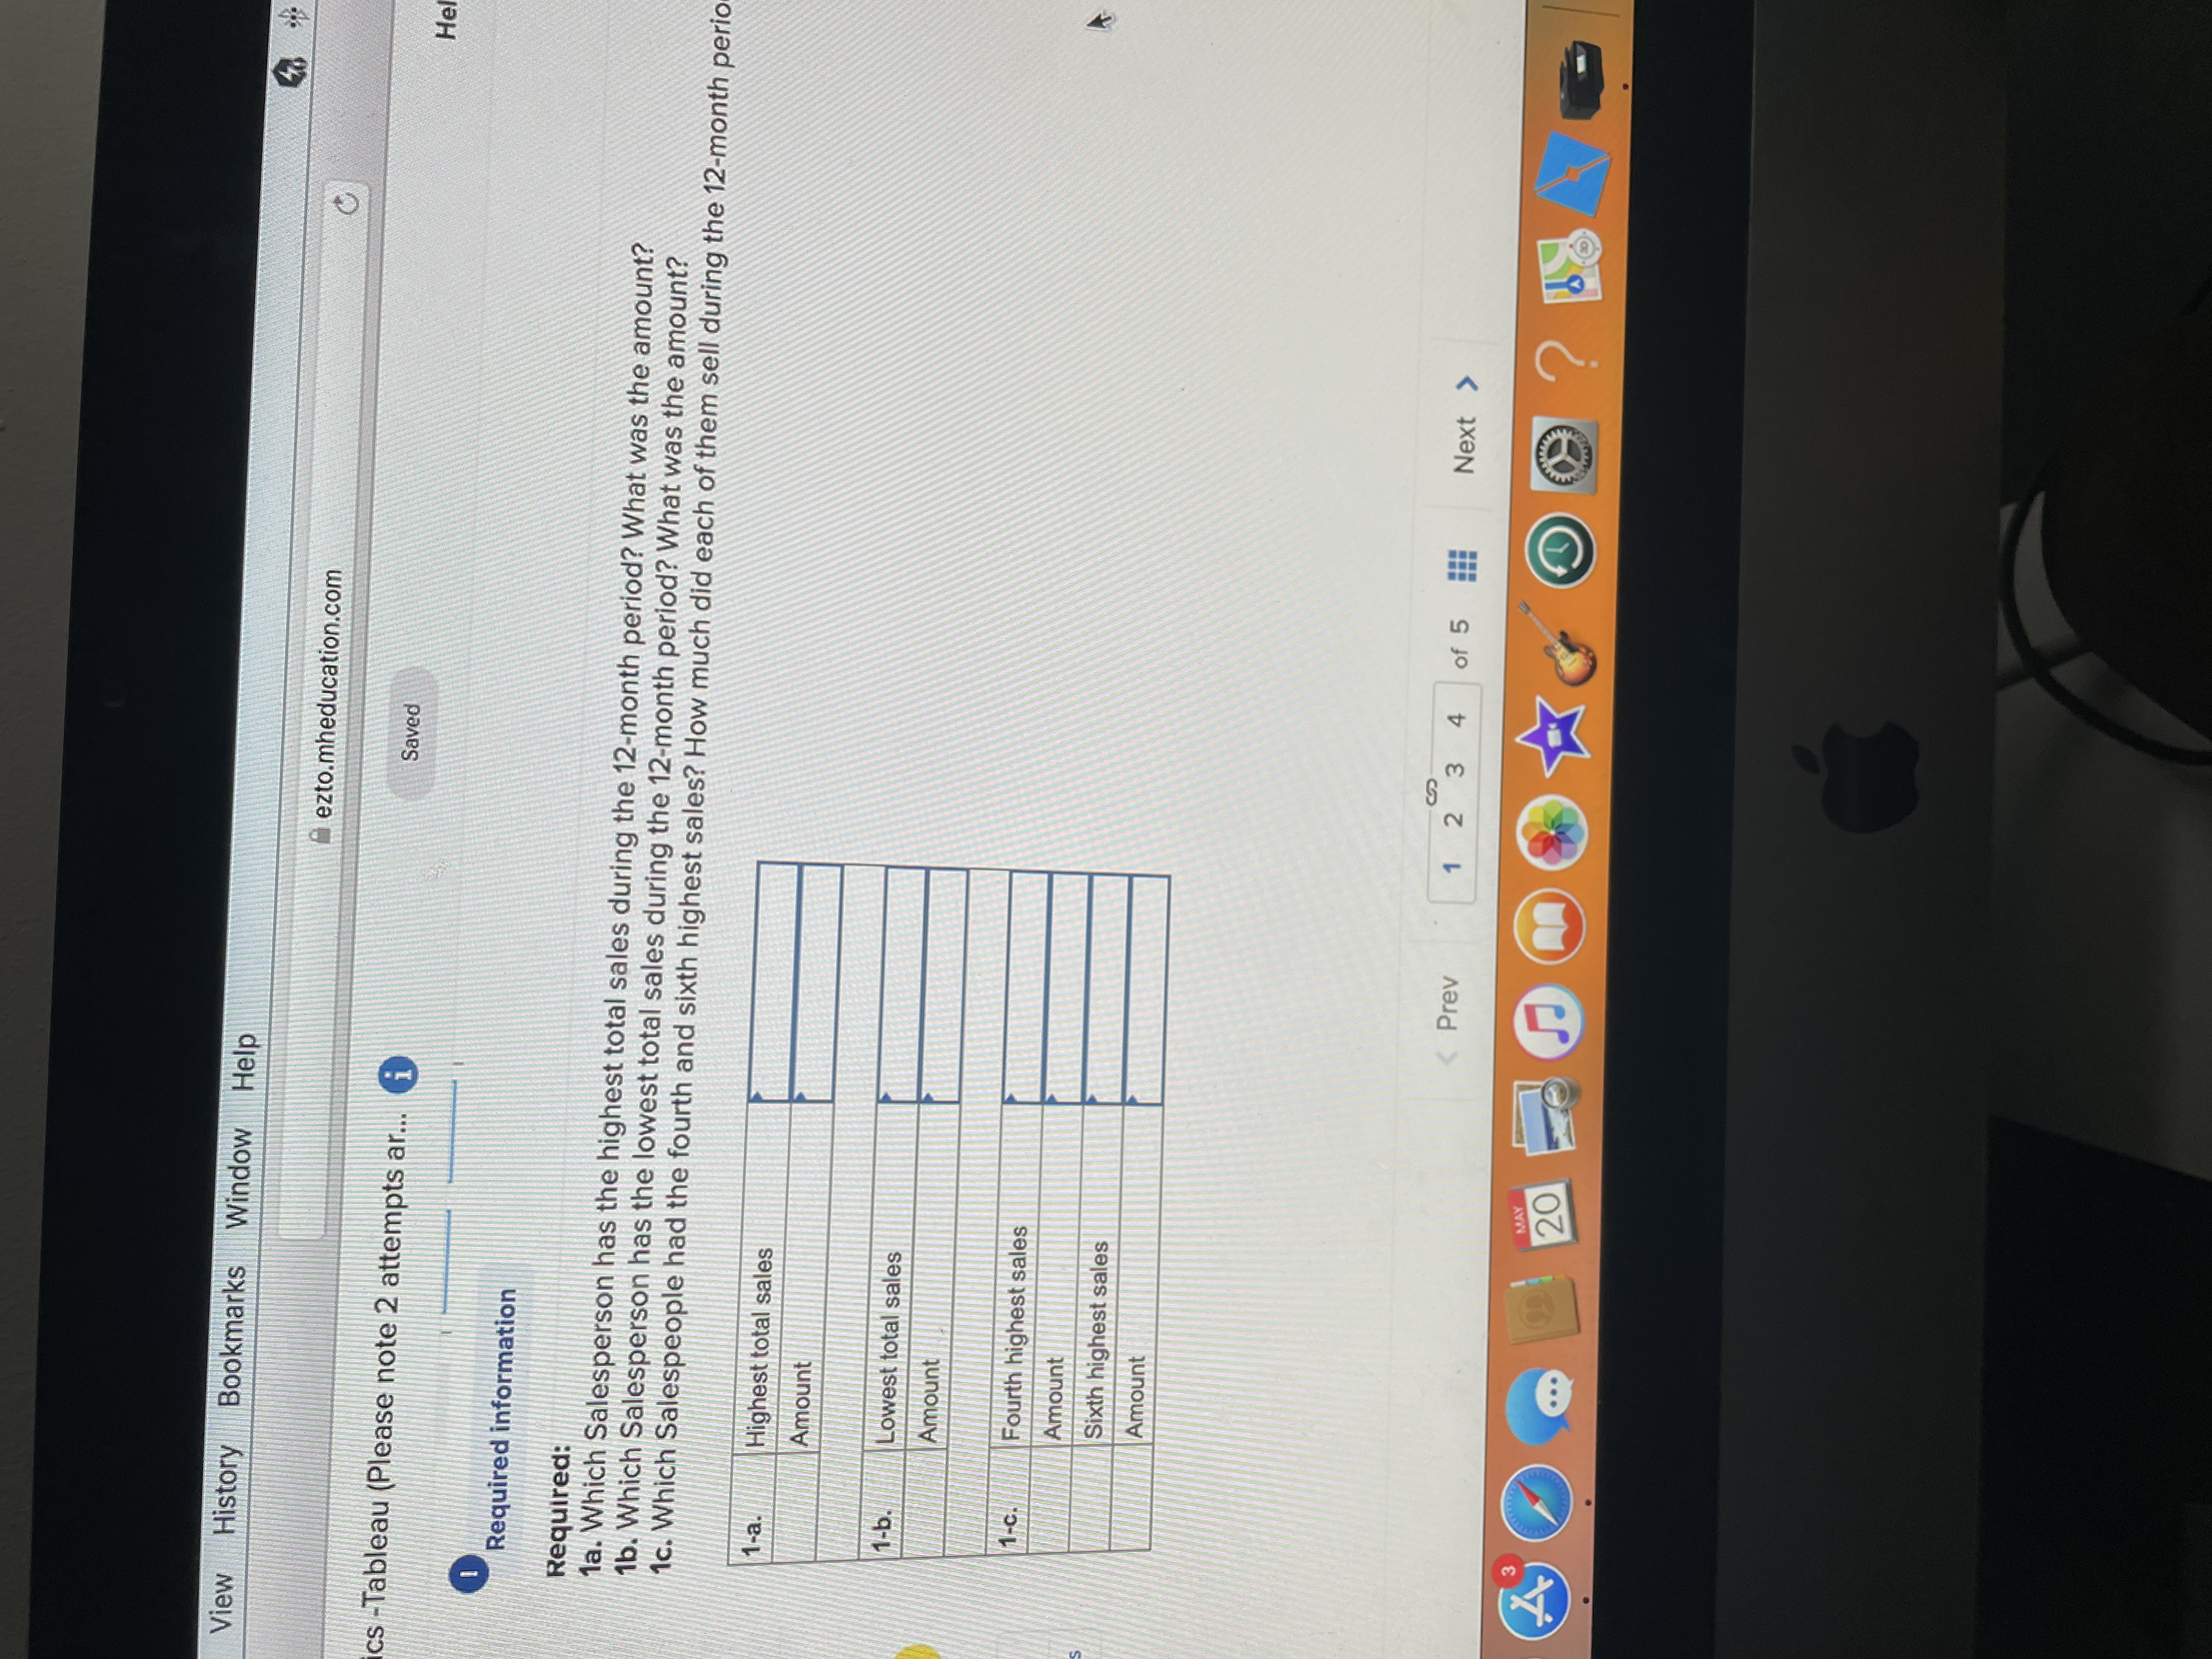
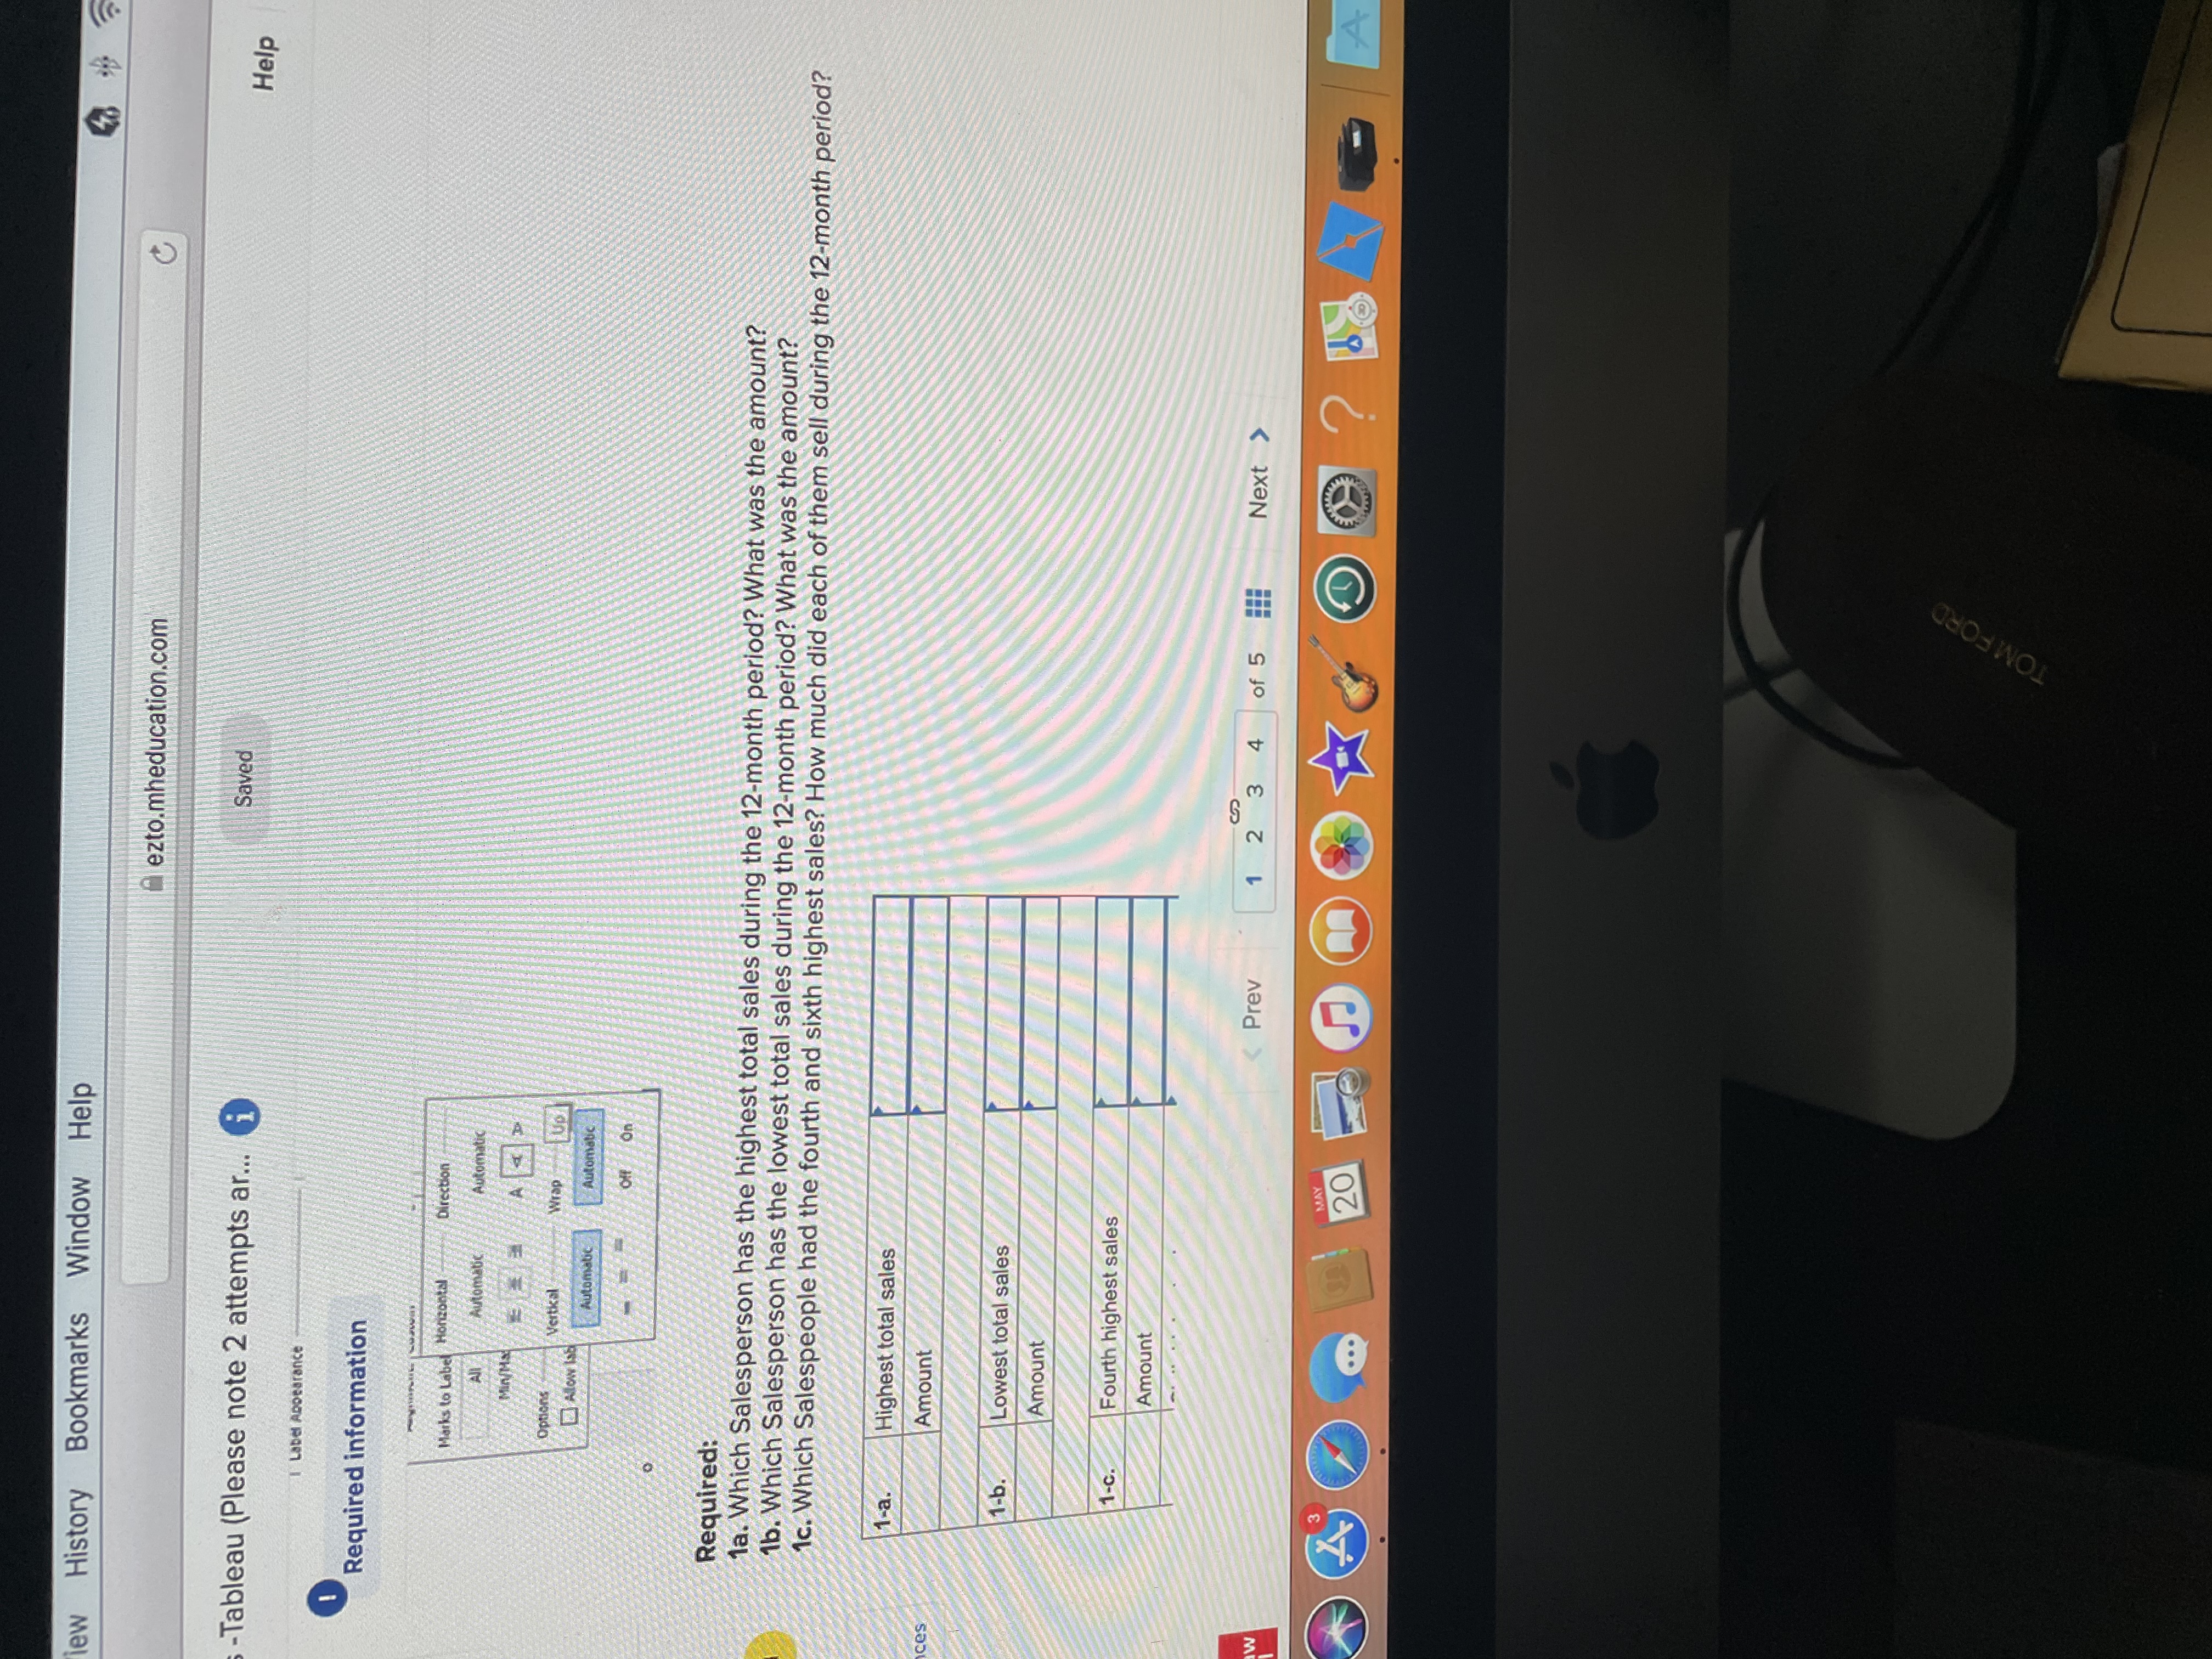


View History Bookmarks Window Help ezto.mheducation.com C cs -Tableau (Please note 2 attempts ar... i Saved Hel Required information Required: la. Which Salesperson has the highest total sales during the 12-month period? What was the amount? 1b. Which Salesperson has the lowest total sales during the 12-month period? What was the amount? 1c. Which Salespeople had the fourth and sixth highest sales? How much did each of them sell during the 12-month peri 1-a. Highest total sales Amount 1-b. Lowest total sales Amount 1-c. Fourth highest sales Amount Sixth highest sales Amount MAY ... 20iew History Bookmarks Window Help ezto.mheducation.com C -Tableau (Please note 2 attempts ar... i Saved Help Label Appearance Required information Marks to Label Horizontal Direction Automatic Automatic Min/MS A T D options Vertical Wrap Up ALow Ise Automatic Automatic Required: la. Which Salesperson has the highest total sales during the 12-month period? What was the amount? 1b. Which Salesperson has the lowest total sales during the 12-month period? What was the amount? 1c. Which Salespeople had the fourth and sixth highest sales? How much did each of them sell during the 12-month period? 1-a. Highest total sales ices Amount 1-b. Lowest total sales Amount 1-c. Fourth highest sales Amount MAY 4 ... 20 O ? H8 4 - A TOM FORDHistory Bookmarks Window Help Inezto.mheducation.com ableau (Please note 2 attempts ar... (i Saved Help Save Required information To complete this exercise, you will need to download and install Tableau on your computer, Tableau provides free instructor and student licenses as well as free videos and support for utilizing and learning the software. Once you are up and running with Tableau, watch the three "Getting Started" Tableau videos. All of Tableau's short training videos can be found here. [The following information applies to the questions displayed below.] Dunder Company sells five types of lumber (Maple, Oak, Walnut, Pine, and Cedar) within 10 states located in the southeastern quadrant of the United States. Its 27 sales representatives completed 1,000 sales transactions during the most recent 12-month period. The company's CFO would like your assistance in creating some Tableau visualizations that enable her to better understand the sales representatives' performance. Download the Excel file, which you will use to create the Tableau visualizations requested by the CFO. Upload the Excel file into Tableau by doing the following: 1. Open the Tableau Desktop application. 2. On the left-hand side, under the "Connect" header and the "To a file" sub-header, click on "Microsoft Excel." 3. Choose the Excel file and click "Open." On the left-hand side under "Sheets," double click on "Dunder_Company." Create a bar chart that summarizes each Salesperson's cumulative sales during the 12-month period: Double click on "Sheet 1" at the bottom of your workbook and rename it "Total Sales by Salesperson." On the left-hand side under "Dimensions" (sometimes labeled as Tables). click on "Salesperson" and draa it to the "Columns" Prev 1 2 3 4 of 5 Next > MAY 20 ? ... TOM FORDdit View History Bookmarks Window Help ezto.mheducation.com C alytics -Tableau (Please note 2 attempts ar... i Saved Help Save & Create a bar chart that summarizes each Salesperson's cumulative sales during the 12-month period: Double click on "Sheet 1" at the bottom of your workbook and rename it "Total Sales by Salesperson." . On the left-hand side under "Dimensions" (sometimes labeled as Tables), click on "Salesperson" and drag it to the "Columns" area above the blank sheet. 1 of On the left-hand side under "Measures", click on "Order Amount" and drag it to the "Rows" area. . This will create a vertical bar chart. The calculation will default to Sum which is what we need for this exercise. Order the bar chart from highest to lowest (Descending) by clicking on the "Descending Sort" button ( ) in the menu bar at the top of the screen. . Label each bar with its respective amount by clicking on "Order Amount" and dragging and dropping it onto the "Label" Marks Skipped card (). . Tableau automatically chooses if the labels will be horizontal or vertical above the bars. If the labels appear horizontal, click Print on the "Label" Marks card ( ) and under "Label Appearance", click on the drop down for "Alignment" and choose the (*) under direction (screenshot below). References Show mark labels Label Appearance Texti
Step by Step Solution
There are 3 Steps involved in it

Get step-by-step solutions from verified subject matter experts