

Question: please help with this question The data shown below represent the repair cost for a low-impact collision in a simple random sample of mini- and
please help with this question
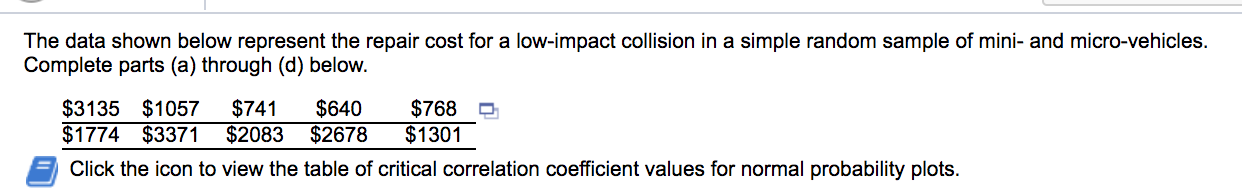
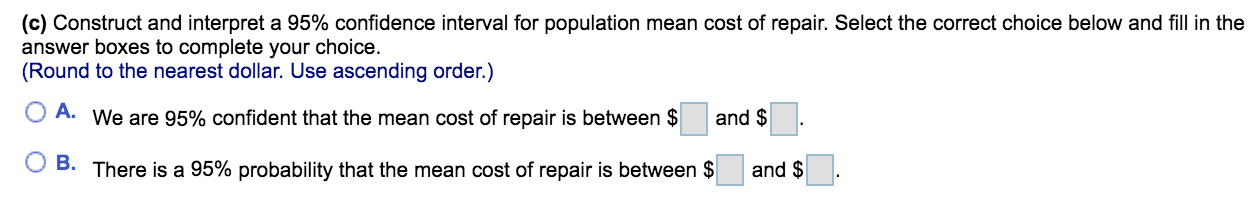
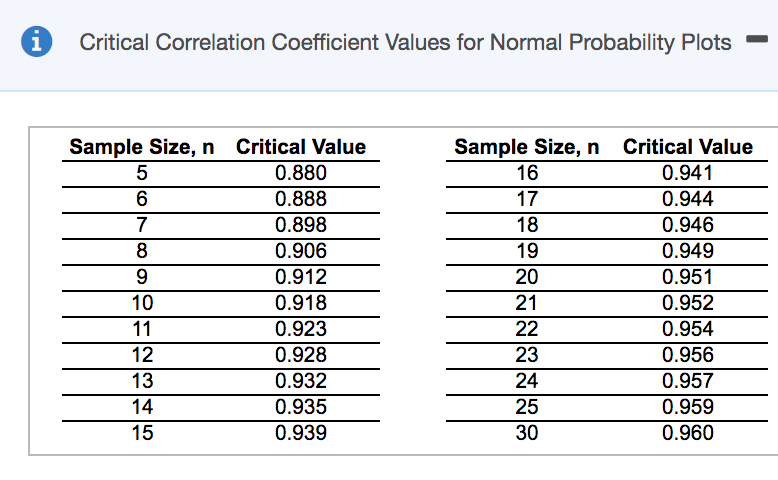
The data shown below represent the repair cost for a low-impact collision in a simple random sample of mini- and micro-vehicles. Complete parts (a) through (d) below. $3135 $1057 $741 $640 $768 Q $1774 $3371 $2083 $2678 $1301 5 Click the icon to view the table of critical correlation coefficient values for normal probability plots. (c) Construct and interpret a 95% confidence interval for population mean cost of repair. Select the correct choice below and fill in the answer boxes to complete your choice. (Round to the nearest dollar. Use ascending order.) O A. We are 95% confident that the mean cost of repair is between $ and $ O B. There is a 95% probability that the mean cost of repair is between $ and $0 Critical Correlation Coefficient Values for Normal Probability Plots - Sample Size, n Critical Value Sample Size, n Critical Value 5 0.880 16 0.941 6 0.888 17 0.944 7 0.898 18 0.946 8 0.906 19 0.949 9 0.912 20 0.951 10 0.918 21 0.952 11 0.923 22 0.954 12 0.928 23 0.956 13 0.932 24 0.957 14 0.935 25 0.959 15 0.939 30 0.960
Step by Step Solution
There are 3 Steps involved in it

Get step-by-step solutions from verified subject matter experts