

Question: The data shown below represent the repair cost for a low-impact collision in a simple random sample of mini- and micro-vehicles. Complete parts (a) through
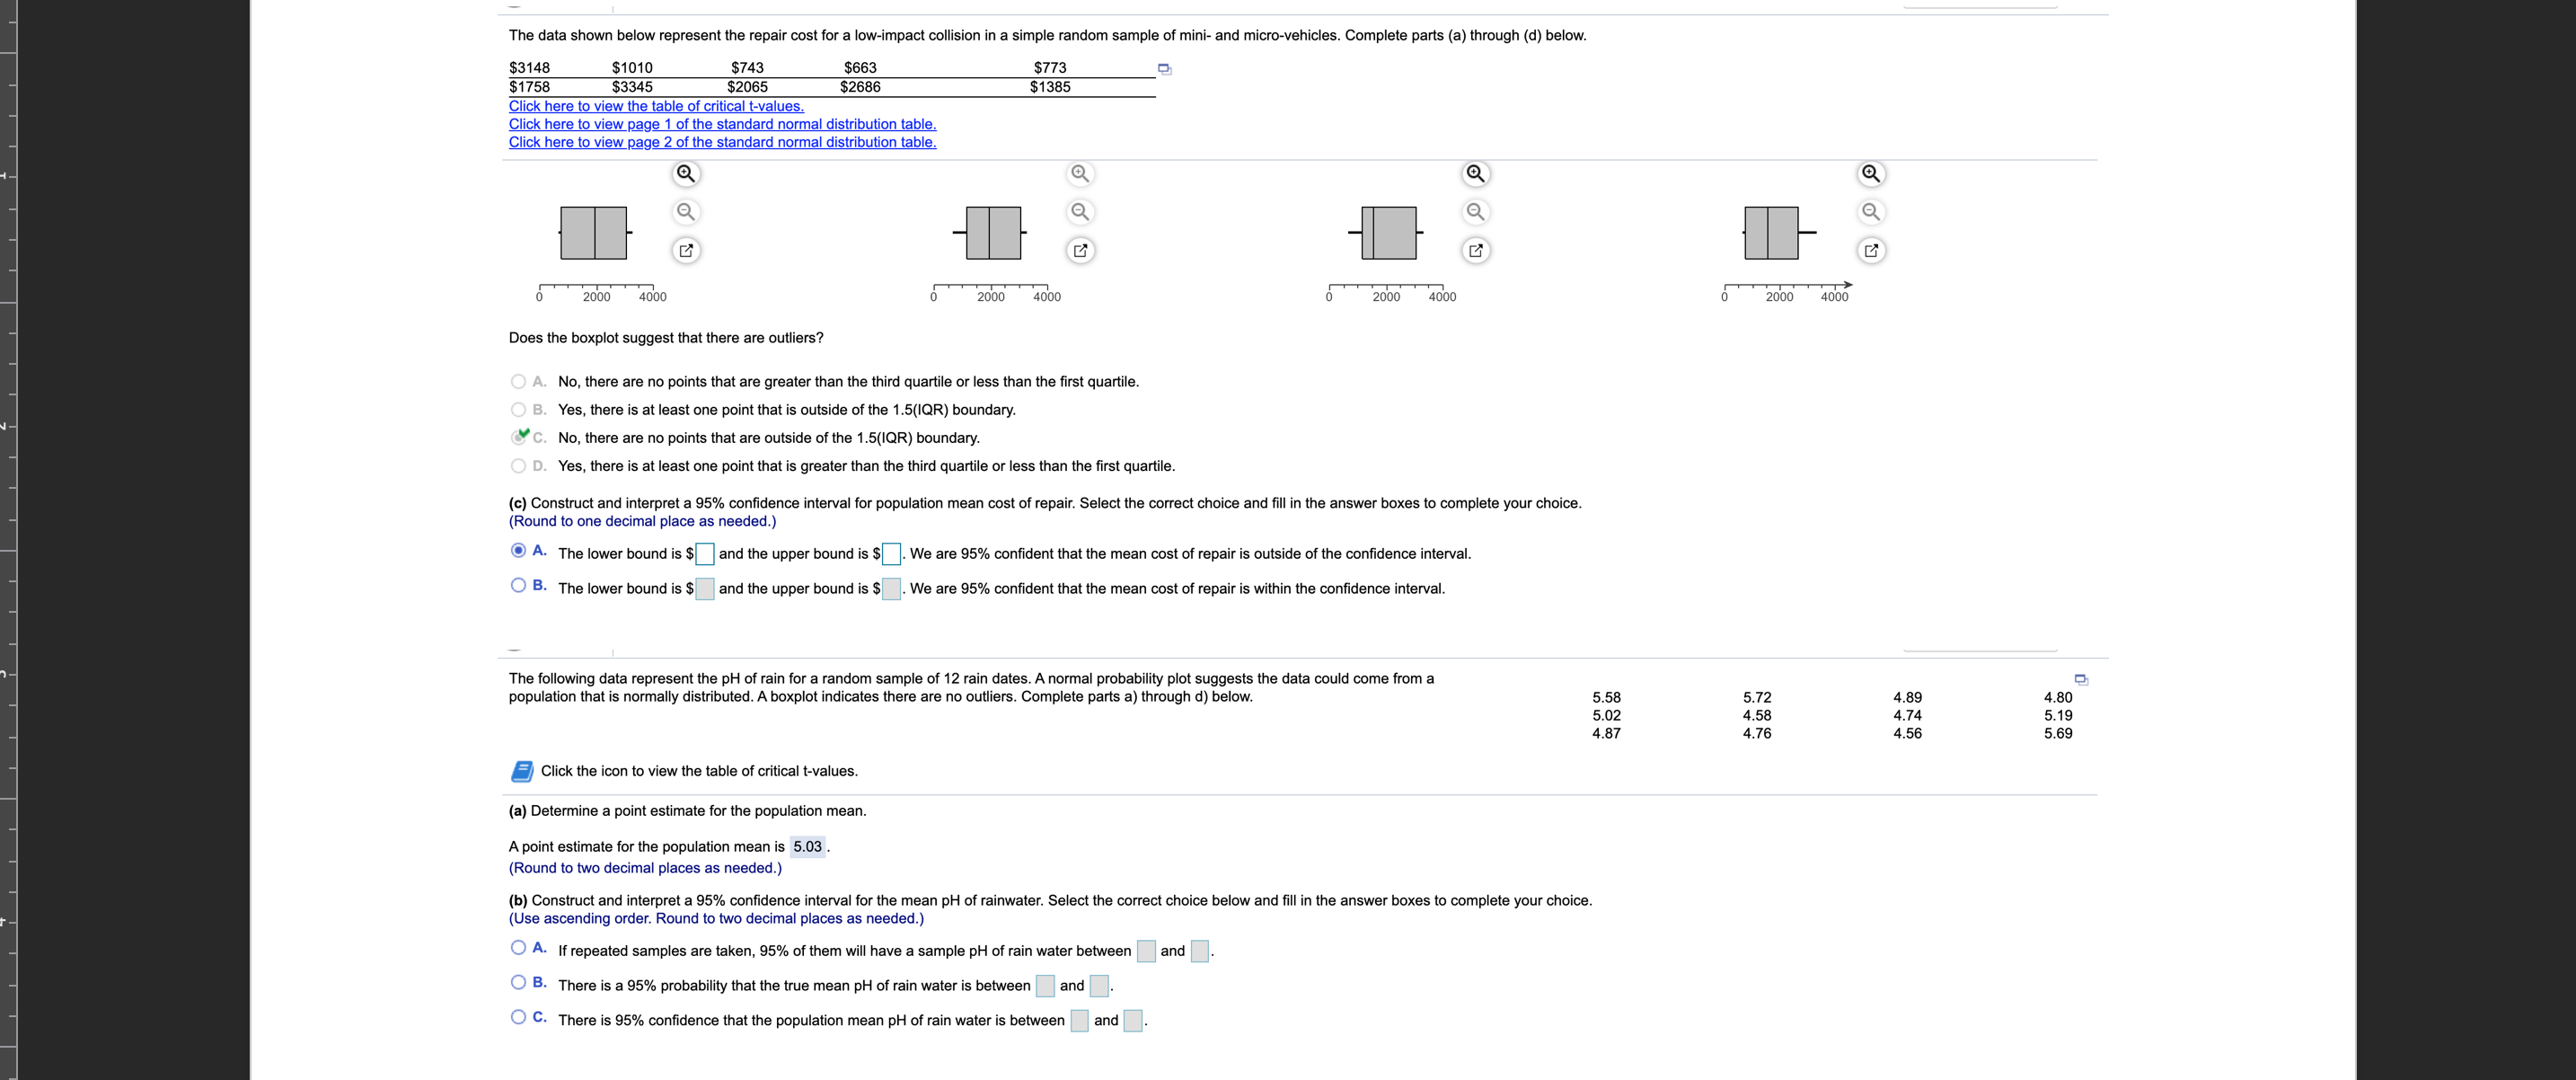
The data shown below represent the repair cost for a low-impact collision in a simple random sample of mini- and micro-vehicles. Complete parts (a) through (d) below. $3148 $1010 $743 $663 $773 $1758 $3345 $2686 $1385 Click here to view the table of critical t-values. Click here to view page 1 of the standard normal distribution table. Click here to view page 2 of the standard normal distribution table Q Q 2 Q 2000 4000 2000 2000 2000 4000 Does the boxplot suggest that there are outliers? A. No, there are no points that are greater than the third quartile or less than the first quartile. B. Yes, there is at least one point that is outside of the 1.5(IQR) boundary. C. No, there are no points that are outside of the 1.5(IQR) boundary. O D. Yes, there is at least one point that is greater than the third quartile or less than the first quartile. (c) Construct and interpret a 95% confidence interval for population mean cost of repair. Select the correct choice and fill in the answer boxes to complete your choice. Round to one decimal place as needed.) A. The lower bound is $ and the upper bound is $ . We are 95% confident that the mean cost of repair is outside of the confidence interval. O B. The lower bound is $ and the upper bound is $ . We are 95% confident that the mean cost of repair is within the confidence interval The following data represent the pH of rain for a random sample of 12 rain dates. A normal probability plot suggests the data could come from a population that is normally distributed. A boxplot indicates there are no outliers. Complete parts a) through d) below 5.58 5.72 4.89 4.80 5.02 4.58 4.74 5.19 4.87 4,76 4.56 5.69 Click the icon to view the table of critical t-values. (a) Determine a point estimate for the population mean. A point estimate for the population mean is 5.03 Round to two decimal places as needed.) (b) Construct and interpret a 95% confidence interval for the mean pH of rainwater. Select the correct choice below and fill in the answer boxes to complete your choice. (Use ascending order. Round to two decimal places as needed.) O A. If repeated samples are taken, 95% of them will have a sample pH of rain water between and O B. There is a 95% probability that the true mean pH of rain water is between and. O C. There is 95% confidence that the population mean pH of rain water is between and
Step by Step Solution
There are 3 Steps involved in it

Get step-by-step solutions from verified subject matter experts