

Question: Please help with this stats problem! Explore the effect of skewness and sample size on confidence intervals. Go to the website https://istats.shinyapps.io/ExploreCoverage/ and click on
Please help with this stats problem!
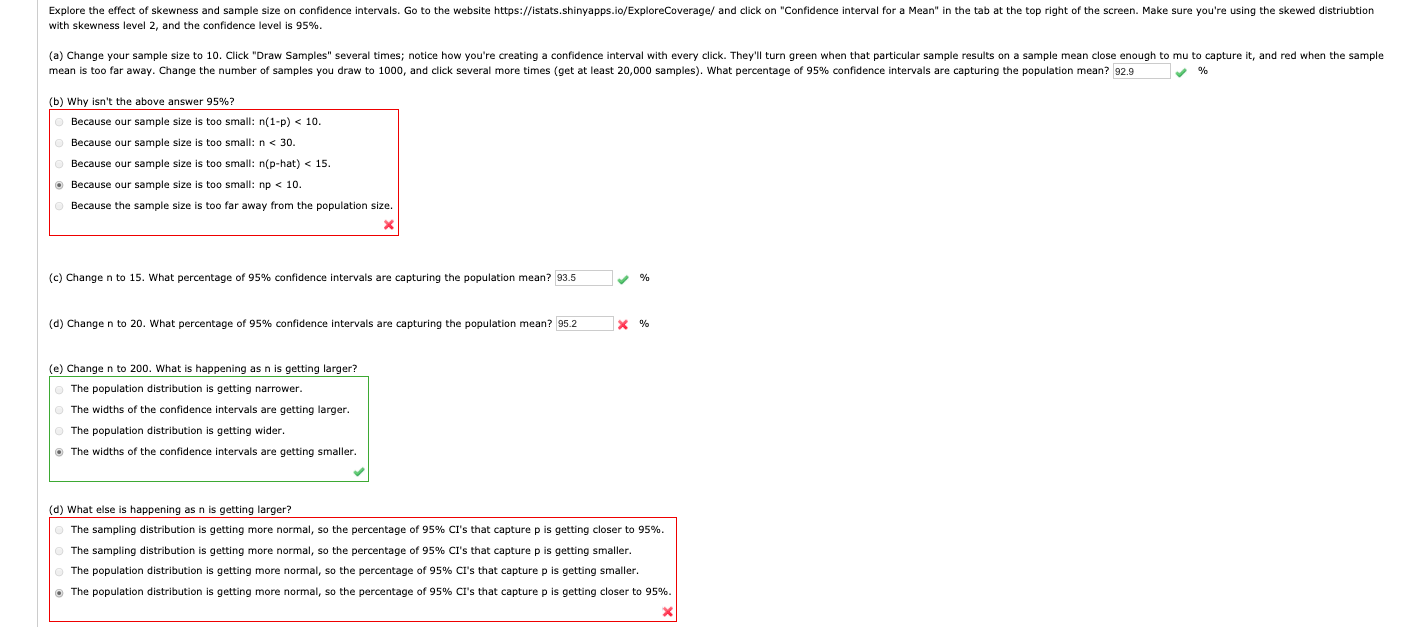
Explore the effect of skewness and sample size on confidence intervals. Go to the website https://istats.shinyapps.io/ExploreCoverage/ and click on "Confidence interval for a Mean" in the tab at the top right of the screen. Make sure you're using the skewed distriubtion with skewness level 2, and the confidence level is 95%. (a) Change your sample size to 10. Click "Draw Samples" several times; notice how you're creating a confidence interval with every click. They'll turn green when that particular sample results on a sample mean close enough to mu to capture it, and red when the sample mean is too far away. Change the number of samples you draw to 1000, and click several more times (get at least 20,000 samples). What percentage of 95% confidence intervals are capturing the population mean? 92.9 % (b) Why isn't the above answer 95%? Because our sample size is too small: n(1-p)
Step by Step Solution
There are 3 Steps involved in it

Get step-by-step solutions from verified subject matter experts