

Question: please help with where to put the coordinates and the answer to the problem at the bottom with the 3 fill in the blank Stock
please help with where to put the coordinates and the answer to the problem at the bottom with the 3 fill in the blank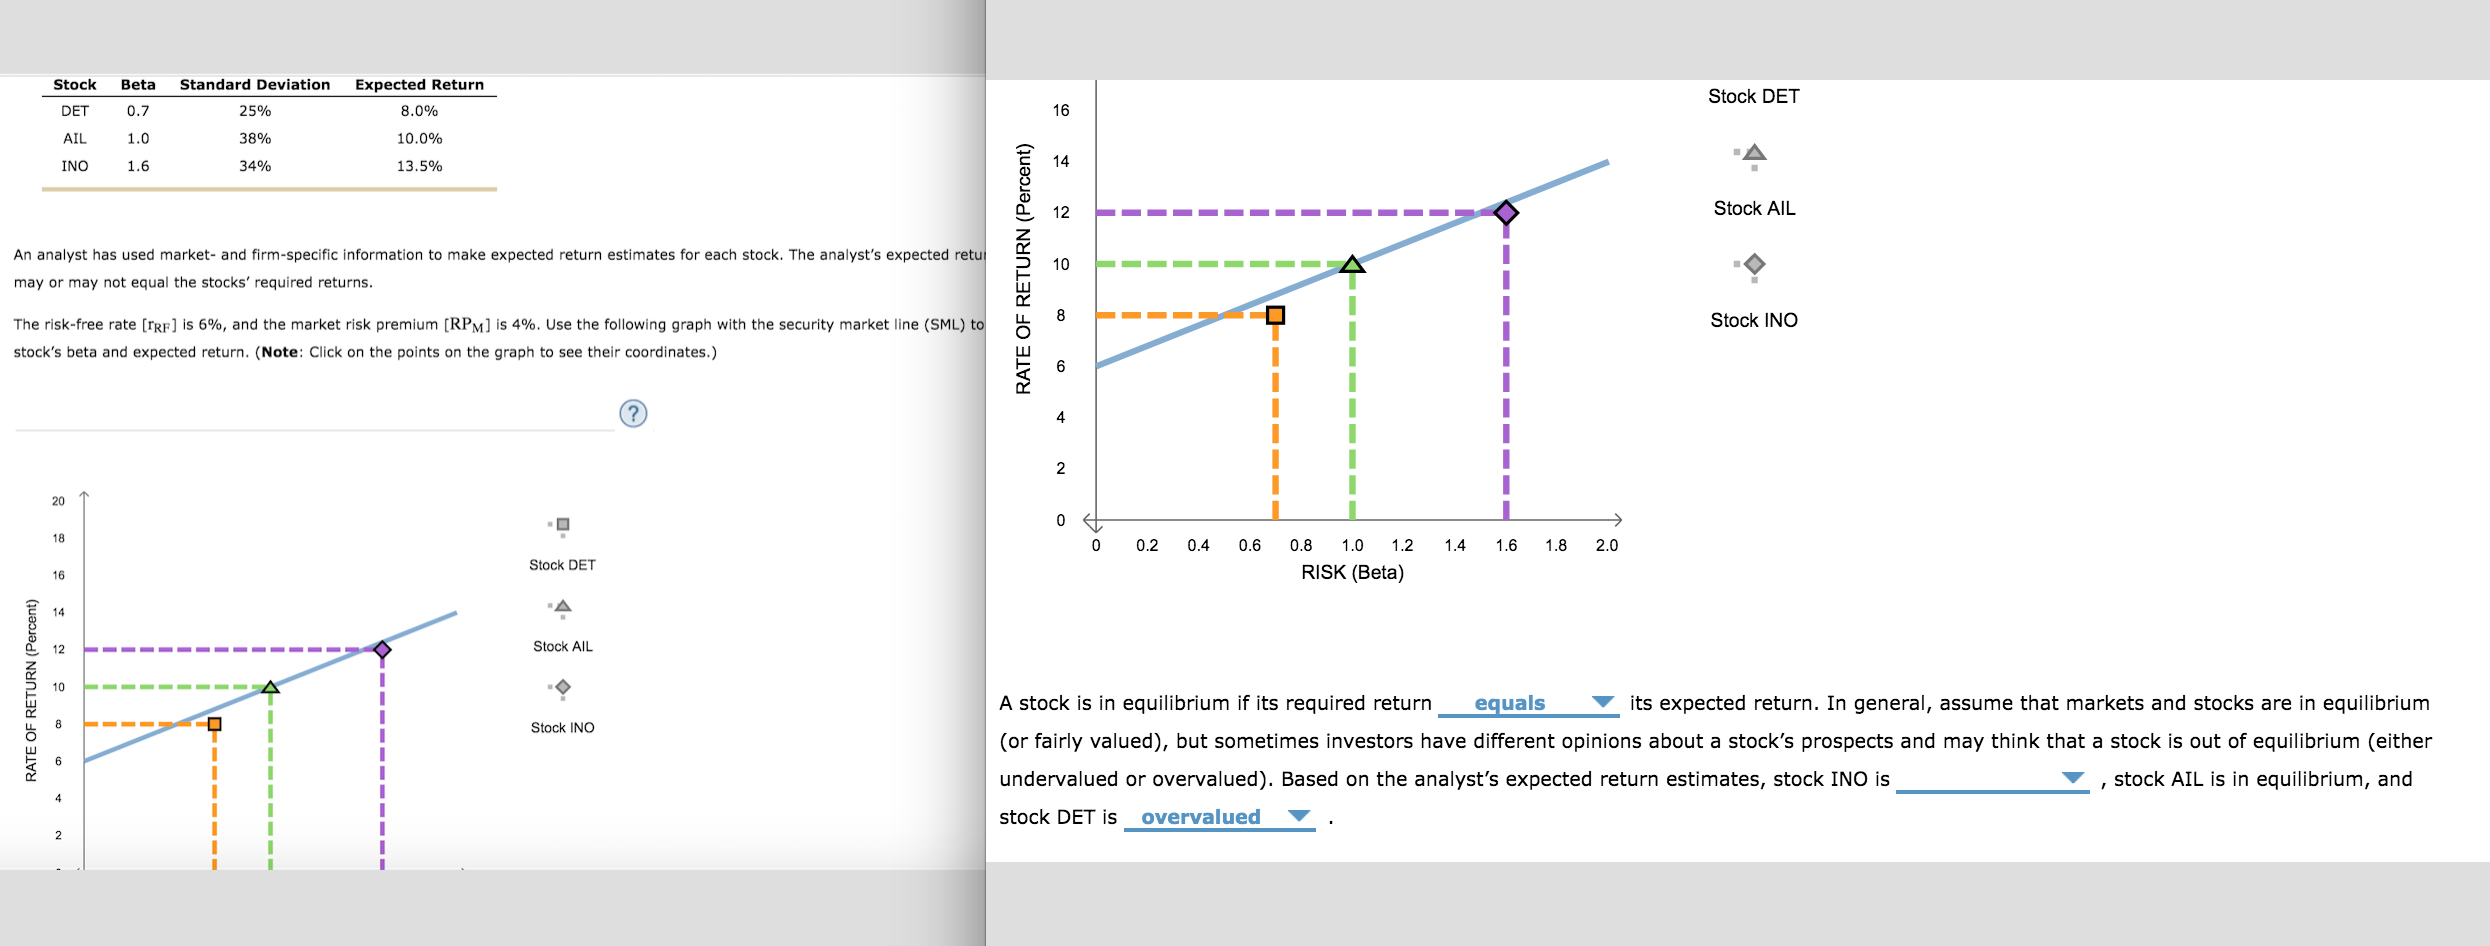
Stock Beta Standard Deviation Expected Return 8.0% Stock DET DET 0.7 25% 16 AIL 1.0 38% 10.0% INO 1.6 34% 13.5% 14 12 Stock AIL An analyst has used market- and firm-specific information to make expected return estimates for each stock. The analyst's expected retu may or may not equal the stocks' required returns. RATE OF RETURN (Percent) 10 8 Stock INO The risk-free rate (TRF) is 6%, and the market risk premium [RPM) is 4%. Use the following graph with the security market line (SML) to stock's beta and expected return. (Note: Click on the points on the graph to see their coordinates.) -1 ? 4 2 20 18 0 h 0 0.2 0.4 0.6 1.4 1.6 1.8 2.0 Stock DET 0.8 1.0 1.2 RISK (Beta) 16 14 12 Stock AIL RATE OF RETURN (Percent) 10 8 Stock INO A stock is in equilibrium if its required return equals its expected return. In general, assume that markets and stocks are in equilibrium (or fairly valued), but sometimes investors have different opinions about a stock's prospects and may think that a stock is out of equilibrium (either undervalued or overvalued). Based on the analyst's expected return estimates, stock INO is stock AIL is in equilibrium, and stock DET is overvalued 1 2
Step by Step Solution
There are 3 Steps involved in it

Get step-by-step solutions from verified subject matter experts