

Question: Please help You have been given the following return data, on three assets-A, B, and C-over the period 2021-2024. Using these assets, you have isolated
 Please help
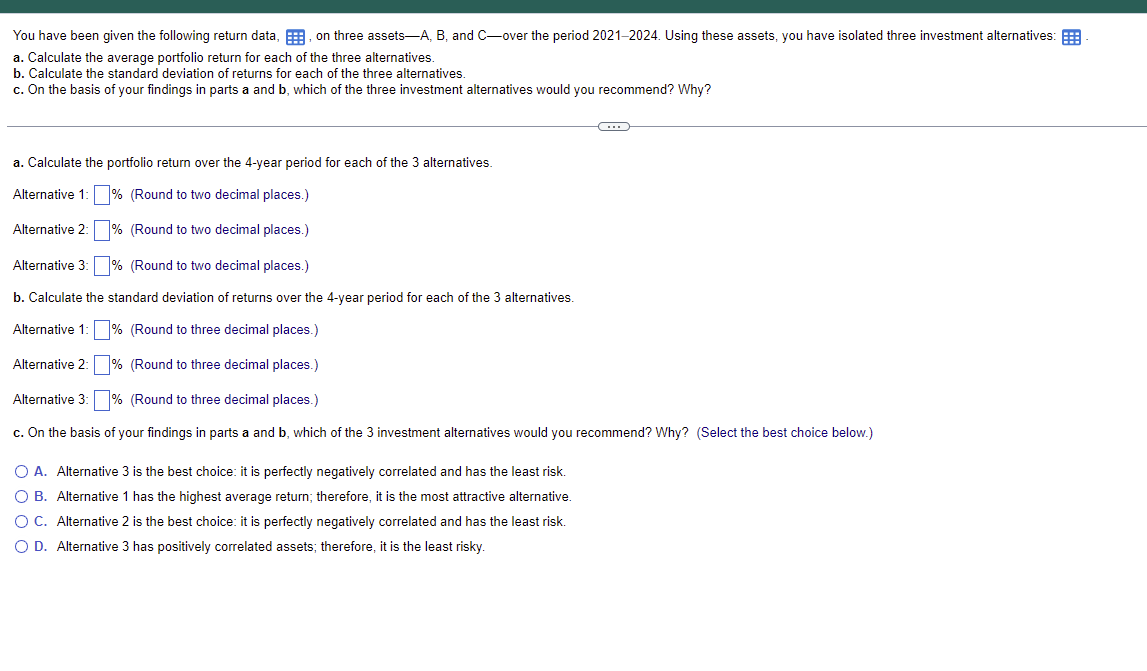
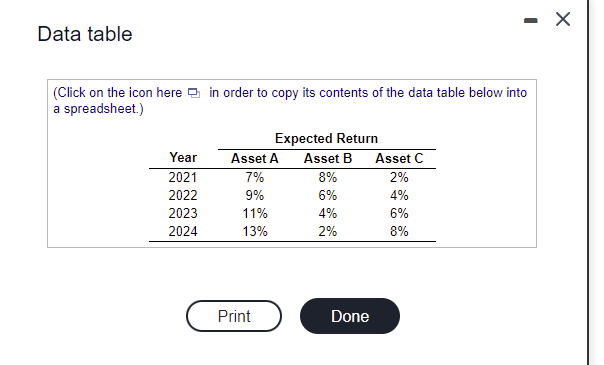
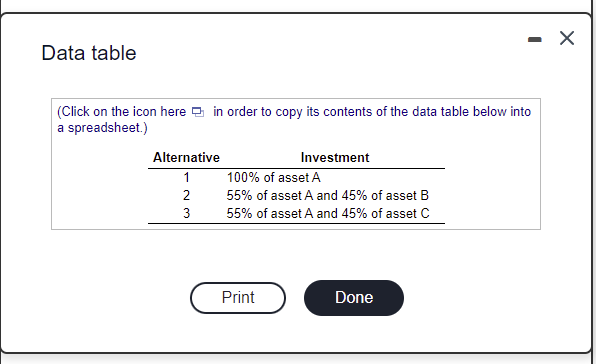
You have been given the following return data, on three assets-A, B, and C-over the period 2021-2024. Using these assets, you have isolated three investment alternatives: a. Calculate the average portfolio return for each of the three alternatives. b. Calculate the standard deviation of returns for each of the three alternatives. c. On the basis of your findings parts a and b, which of the three investment alternatives would you recommend? Why? C a. Calculate the portfolio return over the 4-year period for each of the 3 alternatives. Alternative 1: % (Round to two decimal places.) Alternative 2: % (Round to two decimal places.) Alternative 3: % (Round to two decimal places.) b. Calculate the standard deviation of returns over the 4-year period for each of the 3 alternatives. Alternative 1: % (Round to three decimal places.) Alternative 2: % (Round to three decimal places.) Alternative 3: % (Round to three decimal places.) c. On the basis of your findings in parts a and b, which of the 3 investment alternatives would you recommend? Why? (Select the best choice below.) O A. Alternative 3 is the best choice: it is perfectly negatively correlated and has the least risk. O B. Alternative 1 has the highest average return; therefore, it is the most attractive alternative. O C. Alternative 2 is the best choice: it is perfectly negatively correlated and has the least risk. O D. Alternative 3 has positively correlated assets; therefore, it is the least risky. Data table (Click on the icon here in order to copy its contents of the data table below into a spreadsheet.) Expected Return Year Asset A Asset B Asset C 2021 7% 8% 2% 2022 9% 6% 4% 2023 11% 4% 6% 2024 13% 2% 8% Print Done X Data table (Click on the icon here in order to copy its contents of the data table below into a spreadsheet.) Alternative Investment 1 100% of asset A 2 55% of asset A and 45% of asset B 55% of asset A and 45% of asset C 3 Print Done
Step by Step Solution
There are 3 Steps involved in it

Get step-by-step solutions from verified subject matter experts