

Question: Please, I need clear and step-by-step solution Question 3: (a) KANJAR Company is a manufacturer of light aircraft components in Oman. For the past two
Please, I need clear and step-by-step solution
Question 3: (a) KANJAR Company is a manufacturer of light aircraft components in Oman. For the past two years of operation, the company is experiencing production backlog. A number of its customers are complaining for long delays of deliveries. This backlog is hurting the competitive advantage and the profitability of the company. In order to address this issue, the operation manager decides to implement the following possible alternatives; production overtime, subcontracting, and possible hiring of additional workers if necessary. The company always prepares a nine-month aggregate plan to decide the optimum way to determine requirements for planning purposes, although this is modified when the demand requirements change. The estimated demand for a particular unit for the period January through September is given in Table Q3(a). The current workforce is based on the production level in the previous December. Operating data are given in Table Q3(b). Requirement:
(i) Develop an aggregate plan AP based on level capacity strategy specified for the planning period.Subcontract to meet a 100% service level every month and no overtime, no hiring, and no termination. Show graphically the demand forecast, actual production output, and ending inventory in single graph. Determine the total production cost for the specified period. [7 Marks]
(ii) Table Q3(c) shows the demand orders of aircraft component of a local customer from January to September. Develop a master planning schedule MPS, assuming production lot size of 800 units, and beginning inventory intended for the particular customer is 150 units. In your MPS indicate the projected available balance PAB and the MPS per month. [3 Marks] 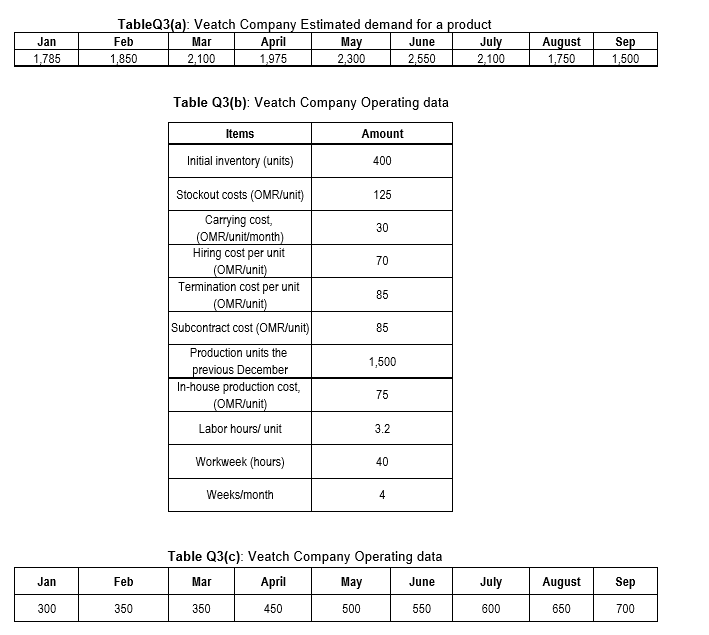
Jan 1.785 TableQ3(a): Veatch Company Estimated demand for a product Feb Mar April May June July 1,850 2.100 1,975 2.300 2,550 2.100 August 1,750 Sep 1,500 Table Q3(b): Veatch Company Operating data Items Amount Initial inventory (units) 400 125 30 70 85 Stockout costs (OMR/unit) Carrying cost, (OMR/unit/month) Hiring cost per unit (OMR/unit) Termination cost per unit (OMR/unit) Subcontract cost (OMR/unit) Production units the previous December In-house production cost, (OMR/unit) Labor hours/ unit 85 1,500 75 3.2 Workweek (hours) 40 Weeks/month 4 Table Q3(c): Veatch Company Operating data Mar April May June Jan Feb July August Sep 300 350 350 450 500 550 600 650 700 Jan 1.785 TableQ3(a): Veatch Company Estimated demand for a product Feb Mar April May June July 1,850 2.100 1,975 2.300 2,550 2.100 August 1,750 Sep 1,500 Table Q3(b): Veatch Company Operating data Items Amount Initial inventory (units) 400 125 30 70 85 Stockout costs (OMR/unit) Carrying cost, (OMR/unit/month) Hiring cost per unit (OMR/unit) Termination cost per unit (OMR/unit) Subcontract cost (OMR/unit) Production units the previous December In-house production cost, (OMR/unit) Labor hours/ unit 85 1,500 75 3.2 Workweek (hours) 40 Weeks/month 4 Table Q3(c): Veatch Company Operating data Mar April May June Jan Feb July August Sep 300 350 350 450 500 550 600 650 700
Step by Step Solution
There are 3 Steps involved in it

Get step-by-step solutions from verified subject matter experts