Question: The solution should be in given form Question 3: (a) KANJAR Company is a manufacturer of light aircraft components in Oman. For the past two
 The solution should be in given form
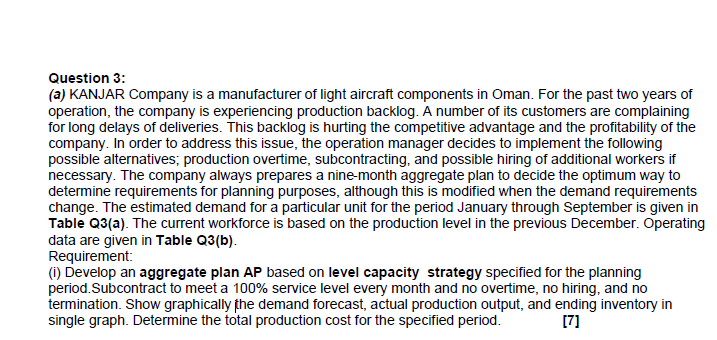
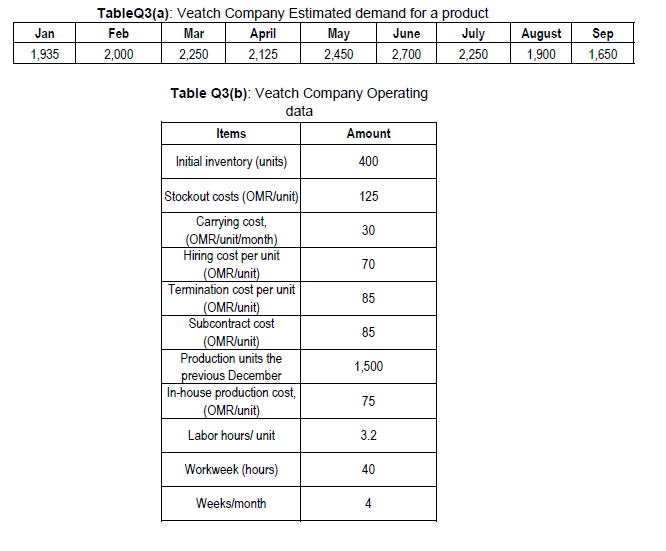
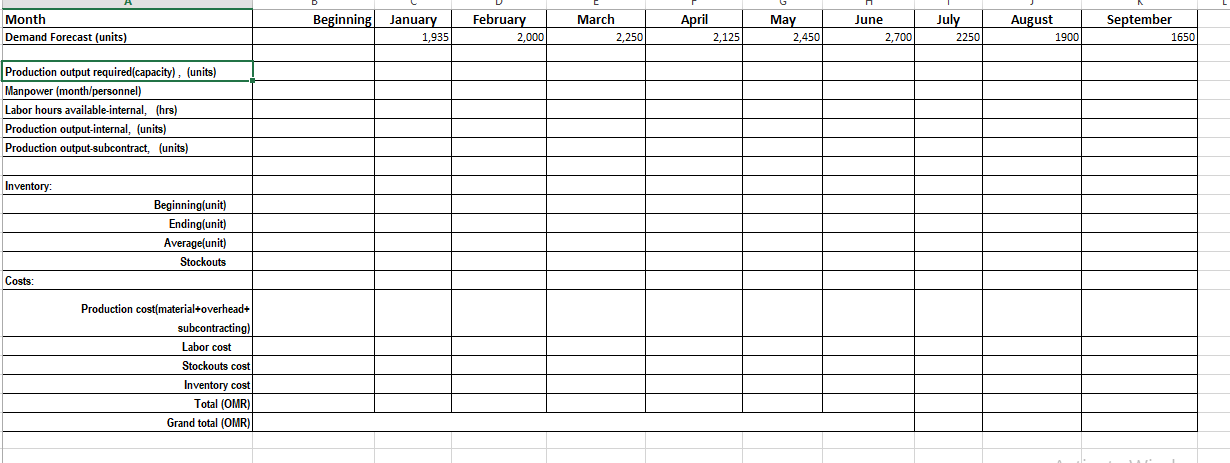
Question 3: (a) KANJAR Company is a manufacturer of light aircraft components in Oman. For the past two years of operation, the company is experiencing production backlog. A number of its customers are complaining for long delays of deliveries. This backlog is hurting the competitive advantage and the profitability of the company. In order to address this issue, the operation manager decides to implement the following possible alternatives, production overtime, subcontracting, and possible hiring of additional workers if necessary. The company always prepares a nine-month aggregate plan to decide the optimum way to determine requirements for planning purposes, although this is modified when the demand requirements change. The estimated demand for a particular unit for the period January through September is given in Table Q3(a). The current workforce is based on the production level in the previous December. Operating data are given in Table Q3(b). Requirement: (1) Develop an aggregate plan AP based on level capacity strategy specified for the planning period. Subcontract to meet a 100% service level every month and no overtime, no hiring, and no termination. Show graphically the demand forecast, actual production output, and ending inventory in single graph. Determine the total production cost for the specified period. [7] Jan 1,935 TableQ3(a): Veatch Company Estimated demand for a product Feb Mar April May June July 2,000 2,250 2,125 2,450 2,700 2,250 August 1,900 Sep 1,650 Table Q3(b): Veatch Company Operating data Items Amount Initial inventory (units) 400 125 30 70 85 Stockout costs (OMR/unit) Carrying cost, (OMR/unit/month) Hiring cost per unit (OMR/unit) Termination cost per unit (OMR/unit) Subcontract cost (OMR/unit) Production units the previous December In-house production cost, (OMR/unit) Labor hours/ unit 85 1,500 75 3.2 Workweek (hours) 40 Weeks/month 4 Month Demand Forecast (units) Beginning January 1,935 February 2,000 March 2,250 April 2,125 May 2,450 June 2,700 July 2250 August 1900 September 1650 Production output required(capacity), (units) Manpower (month/personnel) Labor hours available internal, (hrs) Production output-internal, (units) Production output-subcontract, (units) Inventory Beginning(unit) Ending(unit) Average(unit) Stockouts Costs Production cost material+overhead+ subcontracting) Labor cost Stockouts cost Inventory cost Total (OMR) Grand total (OMR) Question 3: (a) KANJAR Company is a manufacturer of light aircraft components in Oman. For the past two years of operation, the company is experiencing production backlog. A number of its customers are complaining for long delays of deliveries. This backlog is hurting the competitive advantage and the profitability of the company. In order to address this issue, the operation manager decides to implement the following possible alternatives, production overtime, subcontracting, and possible hiring of additional workers if necessary. The company always prepares a nine-month aggregate plan to decide the optimum way to determine requirements for planning purposes, although this is modified when the demand requirements change. The estimated demand for a particular unit for the period January through September is given in Table Q3(a). The current workforce is based on the production level in the previous December. Operating data are given in Table Q3(b). Requirement: (1) Develop an aggregate plan AP based on level capacity strategy specified for the planning period. Subcontract to meet a 100% service level every month and no overtime, no hiring, and no termination. Show graphically the demand forecast, actual production output, and ending inventory in single graph. Determine the total production cost for the specified period. [7] Jan 1,935 TableQ3(a): Veatch Company Estimated demand for a product Feb Mar April May June July 2,000 2,250 2,125 2,450 2,700 2,250 August 1,900 Sep 1,650 Table Q3(b): Veatch Company Operating data Items Amount Initial inventory (units) 400 125 30 70 85 Stockout costs (OMR/unit) Carrying cost, (OMR/unit/month) Hiring cost per unit (OMR/unit) Termination cost per unit (OMR/unit) Subcontract cost (OMR/unit) Production units the previous December In-house production cost, (OMR/unit) Labor hours/ unit 85 1,500 75 3.2 Workweek (hours) 40 Weeks/month 4 Month Demand Forecast (units) Beginning January 1,935 February 2,000 March 2,250 April 2,125 May 2,450 June 2,700 July 2250 August 1900 September 1650 Production output required(capacity), (units) Manpower (month/personnel) Labor hours available internal, (hrs) Production output-internal, (units) Production output-subcontract, (units) Inventory Beginning(unit) Ending(unit) Average(unit) Stockouts Costs Production cost material+overhead+ subcontracting) Labor cost Stockouts cost Inventory cost Total (OMR) Grand total (OMR)


