

Question: please I want it soon... Write a java applet that allows the user to draw his/her data in the form of a chart. First, the
please I want it soon...
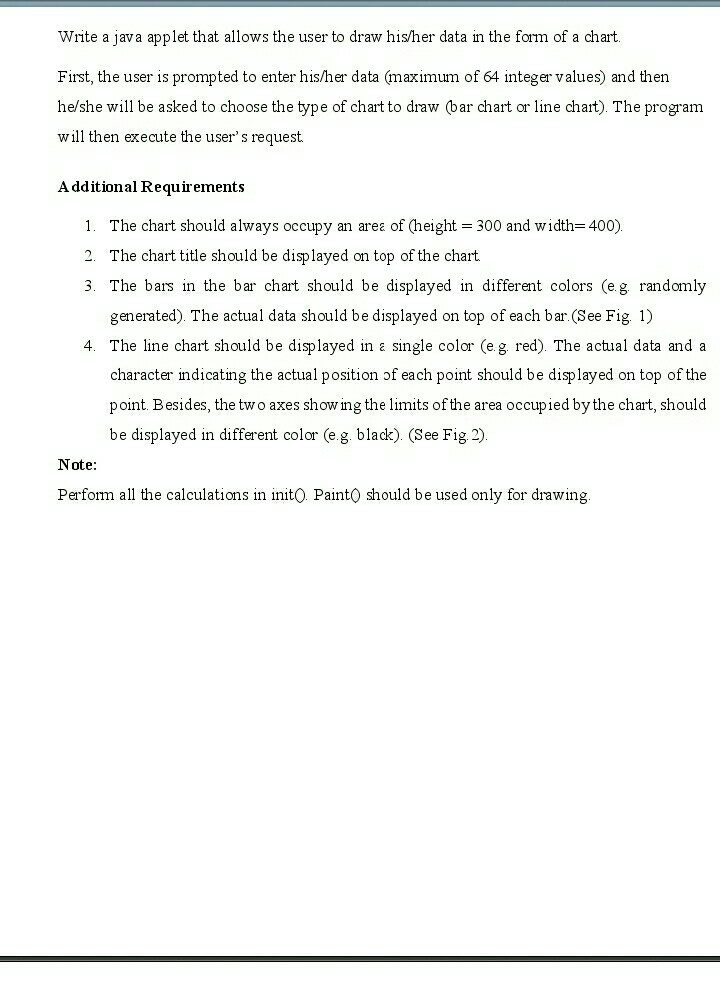
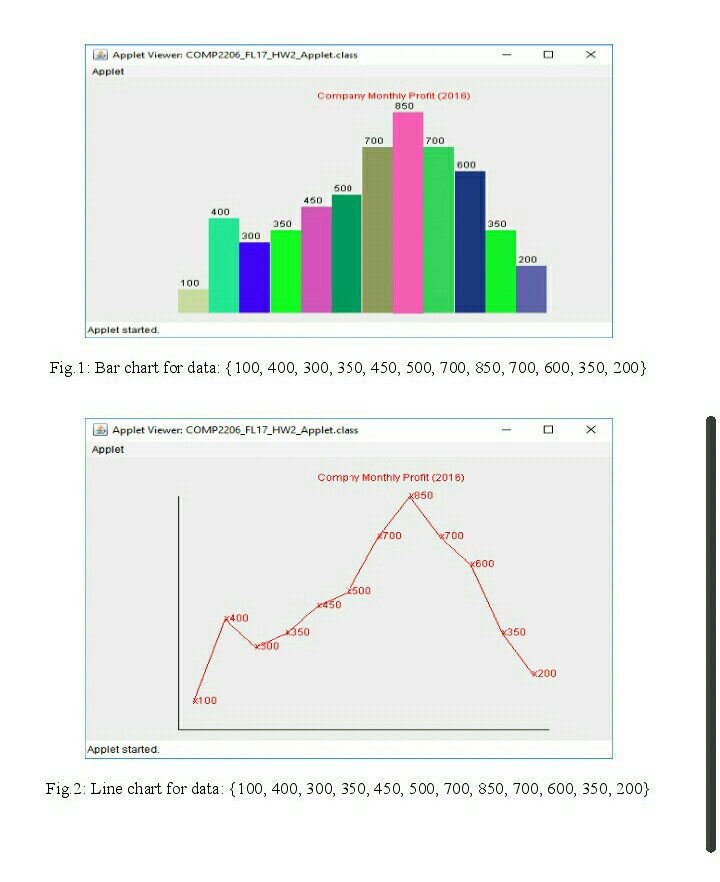
Write a java applet that allows the user to draw his/her data in the form of a chart. First, the user is prompted to enter his/her data (maximum of 64 integer values) and then he/she will be asked to choose the type of chart to draw (bar chart or line chart). The program will then execute the user's request Additional Requirements I. The chart should always occupy an area of height = 300 and width=400) 2. The chart title should be disp layed on top of the chart. 3. The bars in the bar chart should be displayed in different colors (eg randomly generated). The actual data should be displayed on top of each bar.(See Fig1) 4. The line chart should be disp layed in single color (e g red). The actual data and a character indicating the actual position of each point should be displayed on top of the point Besides, the two axes showing the limits of the area occupied by the chart, should be displayed in different color (e.g. black). (See Fig 2) Note: Perfom all the calculations in initO Paint0 should be used only for drawing Write a java applet that allows the user to draw his/her data in the form of a chart. First, the user is prompted to enter his/her data (maximum of 64 integer values) and then he/she will be asked to choose the type of chart to draw (bar chart or line chart). The program will then execute the user's request Additional Requirements I. The chart should always occupy an area of height = 300 and width=400) 2. The chart title should be disp layed on top of the chart. 3. The bars in the bar chart should be displayed in different colors (eg randomly generated). The actual data should be displayed on top of each bar.(See Fig1) 4. The line chart should be disp layed in single color (e g red). The actual data and a character indicating the actual position of each point should be displayed on top of the point Besides, the two axes showing the limits of the area occupied by the chart, should be displayed in different color (e.g. black). (See Fig 2) Note: Perfom all the calculations in initO Paint0 should be used only for drawing
Step by Step Solution
There are 3 Steps involved in it

Get step-by-step solutions from verified subject matter experts