

Question: Please identify any (at least 5) potential RED FLAGS in the B/S and I/S that the auditor may need to look further into. CHAPTER 5:
Please identify any (at least 5) potential RED FLAGS in the B/S and I/S that the auditor may need to look further into.
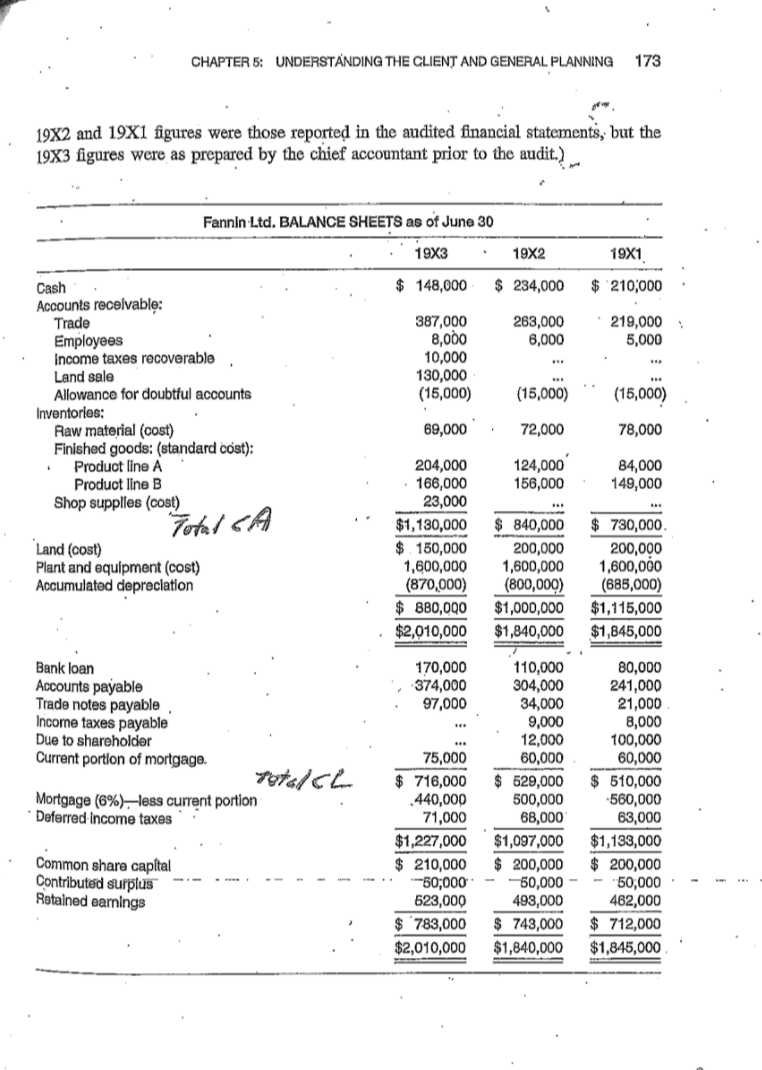
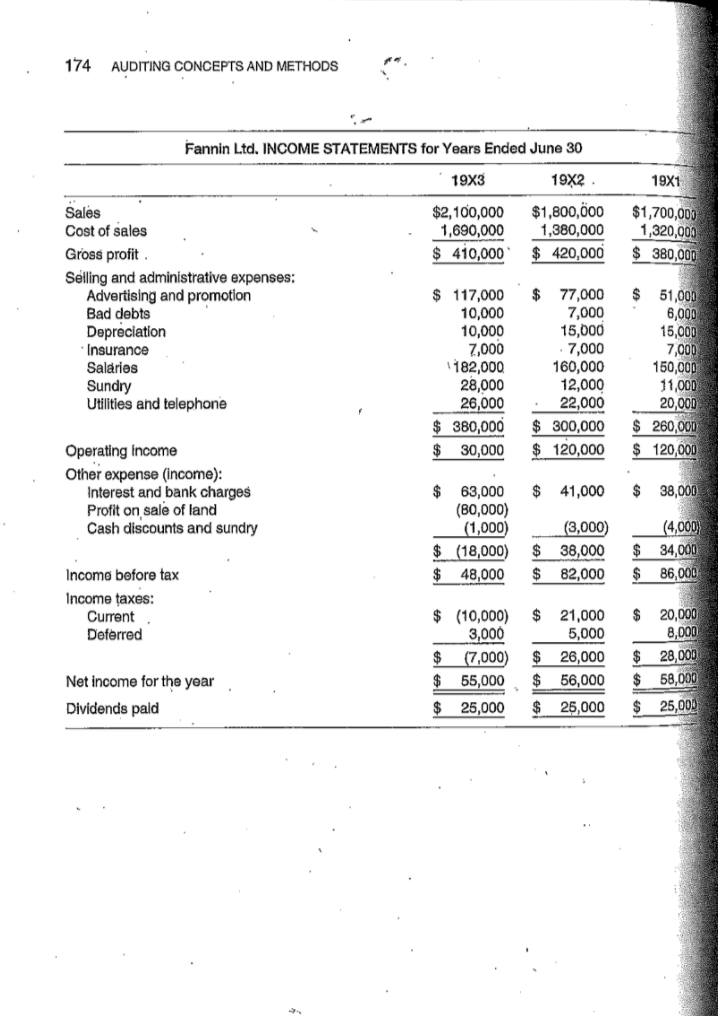
CHAPTER 5: UNDERSTANDING THE CLIENT AND GENERAL PLANNING 173 19X2 and 19X1 figures were those reported in the audited financial statements, but the 1983 figures were as prepared by the chief accountant prior to the audit.) Fannin Ltd. BALANCE SHEETS as of June 30 19X3 19X2 19X1 $ 148,000 $ 234,000 $ 210,000 263,000 6,000 219,000 5,000 387,000 8,000 10,000 130,000 (15,000) (15,000) (15,000) 69,000 72,000 78,000 Cash Accounts receivable: Trade Employees income taxes recoverable Land sale Allowance for doubtful accounts Inventories: Raw material (cost) Finished goods: (standard cost): Product line A Product line B Shop supplies (cost) Total CA Land (cost) Plant and equipment (cost) Accumulated depreciation 124,000 156,000 84,000 149,000 204,000 166,000 23,000 $1,130,000 $ 150,000 1,600,000 (870,000) $ 880,000 $2,010,000 $ 840,000 200,000 1,600,000 (800,000) $1,000,000 $1,840,000 $ 730,000 200,000 1,600,000 (685,000) $1,115,000 $1,845,000 170,000 374,000 97,000 Bank loan Accounts payable Trade notes payable Income taxes payable Due to shareholder Current portion of mortgage. Foto/CL Mortgage (6%) - less current portion Deferred Income taxes 110,000 304,000 34,000 9,000 12,000 60,000 $ 529,000 500,000 68,000 $1,097,000 $ 200,000 50,000 499,000 $ 743,000 $1,840,000 75,000 $ 716,000 440,000 71,000 $1,227,000 $ 210,000 --50,000 623,000 $ 783,000 $2,010,000 80,000 241,000 21,000 8,000 100,000 60,000 $ 510,000 -560,000 63,000 $1,133,000 $ 200,000 50,000 462,000 $ 712,000 $1,845,000 Common share capital Contributed surplus Retained earnings 174 AUDITING CONCEPTS AND METHODS Fannin Ltd. INCOME STATEMENTS for Years Ended June 30 19X3 19X2 19X1 $2,100,000 1,690,000 $ 410,000 $1,800,000 1,380,000 $ 420,000 $1,700,000 1,320,000 $ 380,000 Sales Cost of sales Gross profit Selling and administrative expenses: Advertising and promotion Bad debts Depreciation Insurance Salaries Sundry Utilities and telephone $ 117,000 10,000 10,000 7,000 182,000 28,000 26,000 $ 380,000 $ 30,000 $ 77,000 7,000 15,000 - 7,000 160,000 12,000 22,000 $ 300,000 $ 120,000 $ 51,000 6,000 15,000 7,000 150,000 11,000 20,000 $ 260,000 $ 120,000 Operating Income Other expense (income): Interest and bank charges Profit on sale of land Cash discounts and sundry $ 41,000 $ 38,000 $ 63,000 (80,000) (1,000) $ (18,000) $ 48,000 $ $ (3,000) 38,000 82,000 (4,000 $ 34,000 $ 86,000 Income before tax Income taxes: Current Deferred $ 21,000 5.000 $ (10,000) 3,000 $ (7,000) $ 55,000 $ 20,000 8,000 $ 28,000 $ 58,000 $ $ 26,000 56,000 Net income for the year Dividends pald $ 25,000 $ 25,000 $ 25,000
Step by Step Solution
There are 3 Steps involved in it

Get step-by-step solutions from verified subject matter experts