

Question: Please in excel , this it , this is the complete question. ??? part a ) Develop a linear trend forecast part b ) Add
Please in excel , this it , this is the complete question.
???part a) Develop a linear trend forecast
part b) Add a quadratic component to the model in part (a) and develop a new forecast
part c) Now assume a seasonal pattern and add the seasonality of the months to the linear trend model in part (a) and develop a new forecast
part d) Provide the MSE from the 3 models here
MSE Model aMSE Model bMSE Model c
part e) Based on your answers to part d, for whichever forecast model you deem to be the best, draw a time series graph of both the original time series and the "best" forecast
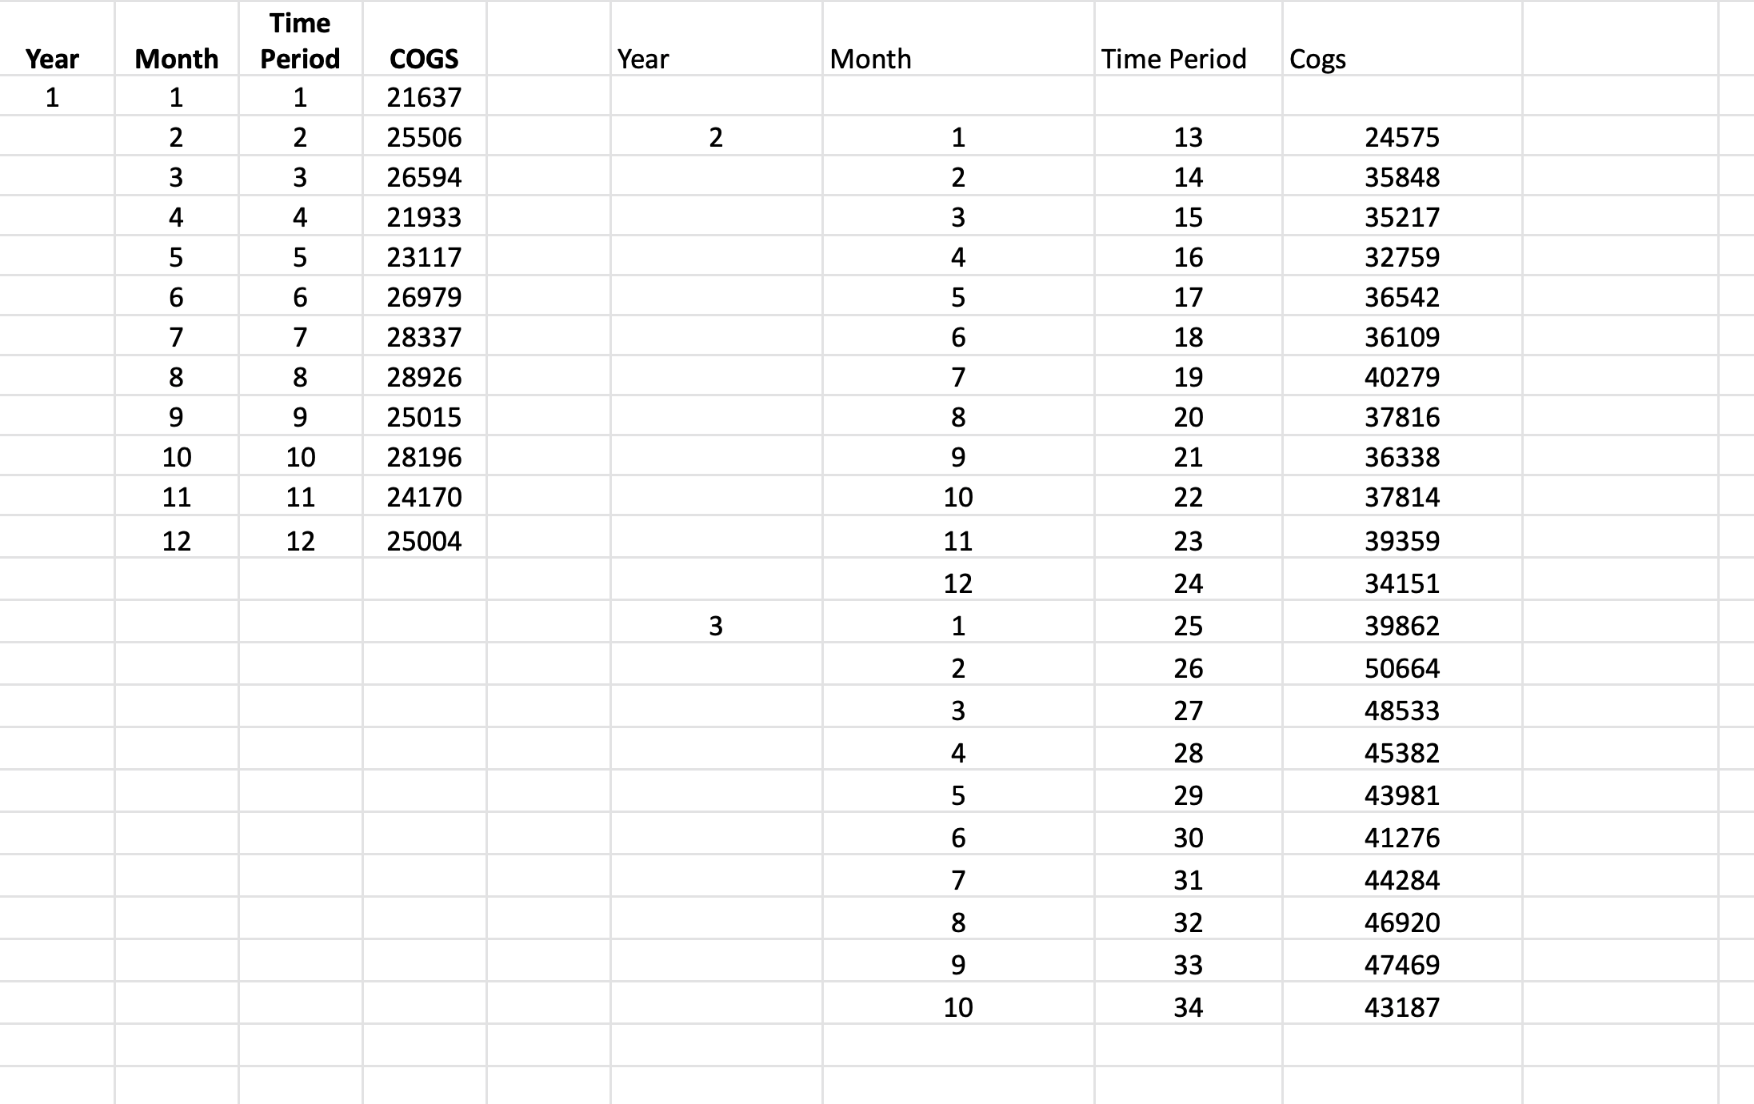
Time Year Month Period COGS Year Month Time Period Cogs 1 1 1 21637 LO OO V O UT A WI 2 25506 2 13 24575 3 26594 14 35848 4 21933 15 35217 5 23117 16 32759 6 26979 17 36542 7 28337 18 36109 8 28926 O L OO V O UT A W N H 19 40279 9 25015 20 37816 10 10 28196 21 36338 11 11 24170 22 37814 12 12 25004 23 39359 24 34151 W LO OO VON UT A W N H J 25 39862 26 50664 27 48533 28 45382 29 43981 30 41276 31 44284 32 46920 33 47469 10 34 43187
Step by Step Solution
There are 3 Steps involved in it

Get step-by-step solutions from verified subject matter experts