

Question: Please include all the solution for each letter. Chapter 3 (3.15) problem is also provided. 4.9.* Refer to the scenario described in Problem 3.15 (Chapter
Please include all the solution for each letter. 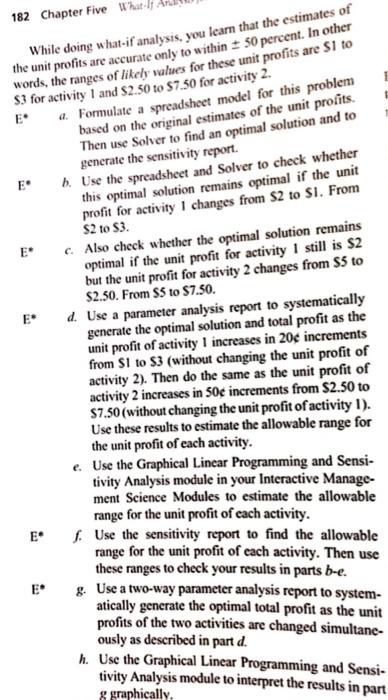
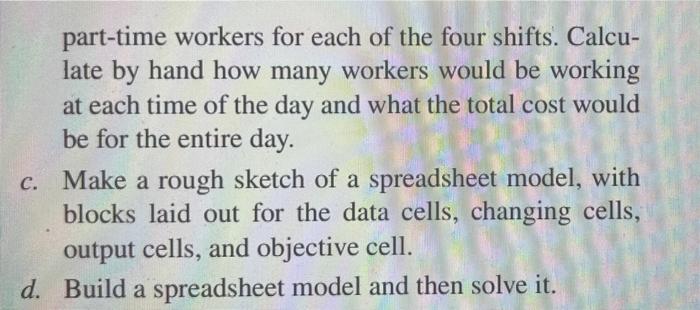
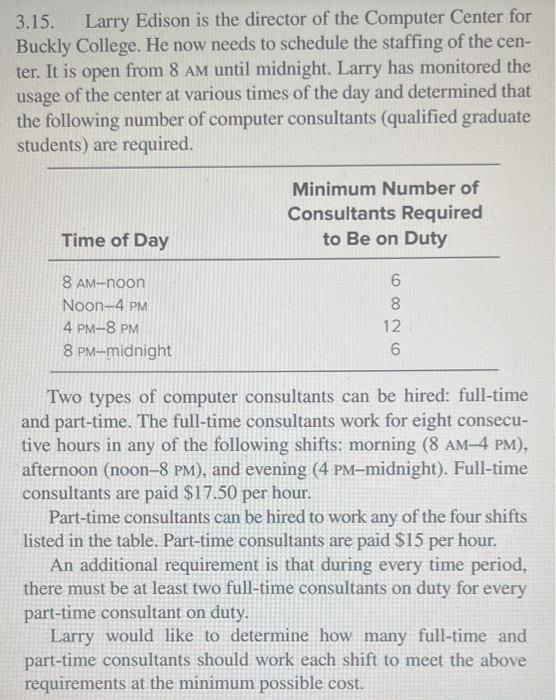
4.9.* Refer to the scenario described in Problem 3.15 (Chapter 3), but ignore the instructions given there. Focus instead on using spreadsheet modeling to address Larry Edison's problem by doing the following. a. Visualize where you want to finish. What are the deci- sions that need to be made? What should the objective be? What are the numbers that Larry will require? b. Suppose that Larry were to hire three full-time workers for the morning shift, two for the afternoon shift, and four for the evening shift, as well as three part-time workers for each of the four shifts. Calcu- late by hand how many workers would be working at each time of the day and what the total cost would be for the entire day. c. Make a rough sketch of a spreadsheet model, with blocks laid out for the data cells, changing cells, output cells, and objective cell. d. Build a spreadsheet model and then solve it. 3.15. Larry Edison is the director of the Computer Center for Buckly College. He now needs to schedule the staffing of the cen- ter. It is open from 8 AM until midnight. Larry has monitored the usage of the center at various times of the day and determined that the following number of computer consultants (qualified graduate students) are required. Minimum Number of Consultants Required to Be on Duty Time of Day 8 AM-noon Noon-4 PM 4 PM-8 PM 8 PM-midnight 6 8 12 6 Two types of computer consultants can be hired: full-time and part-time. The full-time consultants work for eight consecu- tive hours in any of the following shifts: morning (8 AM4 PM), afternoon (noon8 PM), and evening (4 PM-midnight). Full-time consultants are paid $17.50 per hour. Part-time consultants can be hired to work any of the four shifts listed in the table. Part-time consultants are paid $15 per hour. An additional requirement is that during every time period, there must be at least two full-time consultants on duty for every part-time consultant on duty. Larry would like to determine how many full-time and part-time consultants should work each shift to meet the above requirements at the minimum possible cost. 182 Chapter Five What- While doing what-if analysis, you learn that the estimates of the unit profits are accurate only to within + 50 percent. In other words, the ranges of likely values for these unit profits are Si to S3 for activity and $2.50 to $7.50 for activity 2. a. Formulate a spreadsheet model for this problem based on the original estimates of the unit profits. Then use Solver to find an optimal solution and to generate the sensitivity report. E h. Use the spreadsheet and Solver to check whether this optimal solution remains optimal if the unit profit for activity I changes from S2 to SI. From $2 to 53. E c. Also check whether the optimal solution remains optimal if the unit profit for activity I still is S2 but the unit profit for activity 2 changes from $5 to $2.50. From 5 to $7.50. E d. Use a parameter analysis report to systematically generate the optimal solution and total profit as the unit profit of activity 1 increases in 20 increments from $1 to $3 (without changing the unit profit of activity 2). Then do the same as the unit profit of activity 2 increases in 50 increments from $2.50 to * E* $7.50(without changing the unit profit of activity 1). Use these results to estimate the allowable range for the unit profit of each activity. e. Use the Graphical Linear Programming and Sensi- tivity Analysis module in your Interactive Manage- ment Science Modules to estimate the allowable range for the unit profit of each activity. 1. Use the sensitivity report to find the allowable range for the unit profit of each activity. Then use these ranges to check your results in parts b-e. g. Use a two-way parameter analysis report to system- atically generate the optimal total profit as the unit profits of the two activities are changed simultane- ously as described in part d. h. Use the Graphical Linear Programming and Sensi- tivity Analysis module to interpret the results in part g graphically. E Chapter 3 (3.15) problem is also provided. 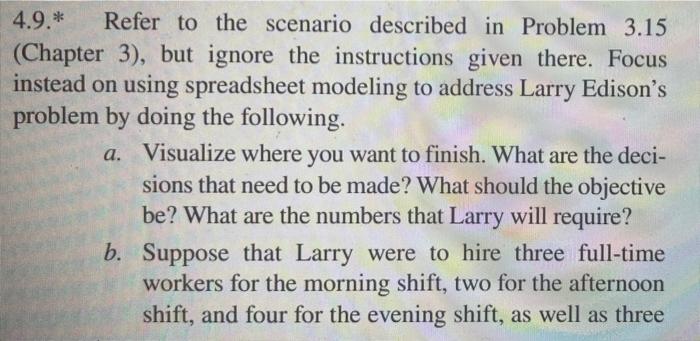
Step by Step Solution
There are 3 Steps involved in it
1 Expert Approved Answer
Step: 1 Unlock

Question Has Been Solved by an Expert!
Get step-by-step solutions from verified subject matter experts
Step: 2 Unlock
Step: 3 Unlock