

Question: please include an excel or minitab to the solution ( not the actual file but a clear screen shot) 3. Ten samples of 200 observations
please include an excel or minitab to the solution ( not the actual file but a clear screen shot)
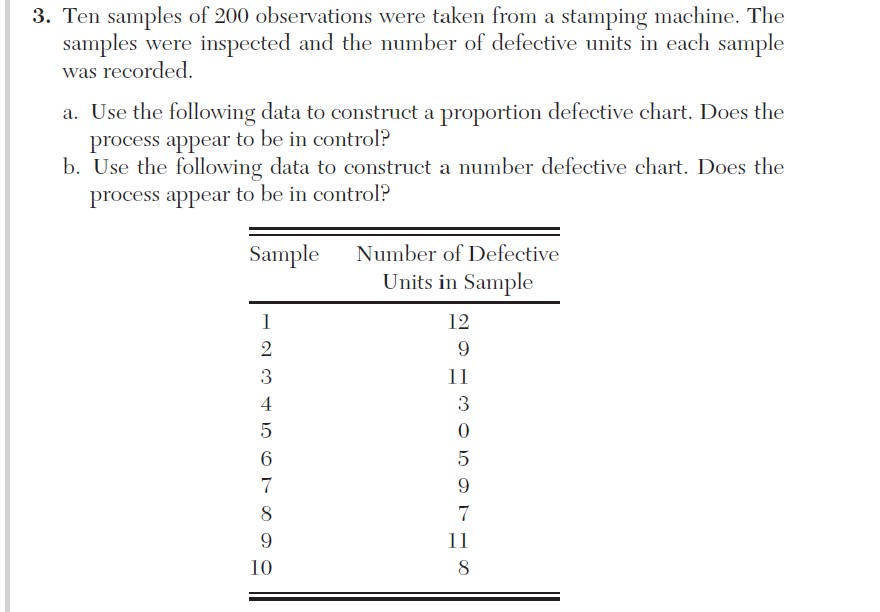
3. Ten samples of 200 observations were taken from a stamping machine. The samples were inspected and the number of defective units in each sample was recorded. a. Use the following data to construct a proportion defective chart. Does the process appear to be in control? b. Use the following data to construct a number defective chart. Does the process appear to be in control? Sample Number of Defective Units in Sample ooooooooStep by Step Solution
There are 3 Steps involved in it
1 Expert Approved Answer
Step: 1 Unlock

Question Has Been Solved by an Expert!
Get step-by-step solutions from verified subject matter experts
Step: 2 Unlock
Step: 3 Unlock