

Question: In ongoing economic analyses, the U.S. federal govemment compares per capita incomes not only among different states but also for the same state at
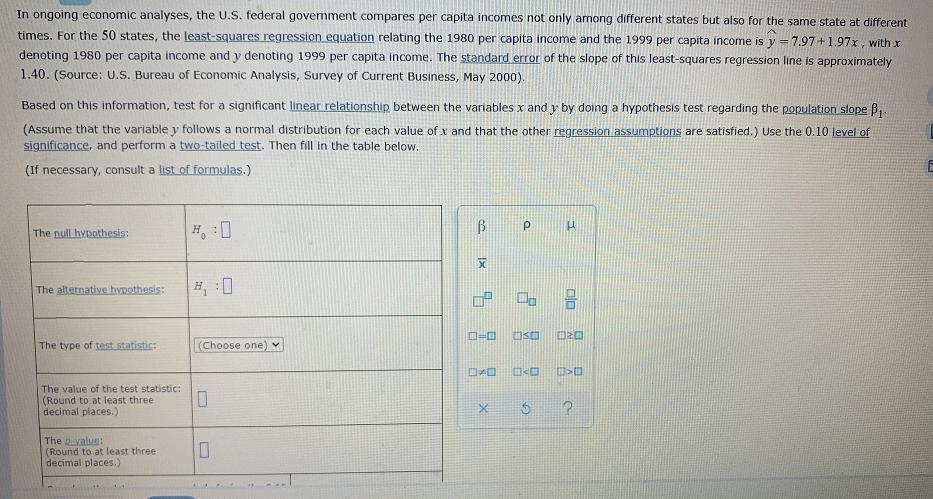

In ongoing economic analyses, the U.S. federal govemment compares per capita incomes not only among different states but also for the same state at different times, For the 50 states, the least-squares regression equation relating the 1980 per capita income and the 1999 per capita income is y = 7.97 + 1.97x, with x denoting 1980 per capita income and y denoting 1999 per capita income. The standard error of the slope of this least-squares regression line is approximately 1.40. (Source: U.S. Bureau of Economic Analysis, Survey of Current Business, May 2000). Based on this information, test for a significant linear relationship between the variables x and y by doing a hypothesis test regarding the population slope B,. (Assume that the variable y follows a normal distribution for each value of x and that the other regression assumptions are satisfied.) Use the 0.10 level of significance, and perform a two-tailed test. Then fill in the table below. y (If necessary, consult a list of formulas.) The null hypothesis: 0. The alternative hynothesis: D=0 The type of test statistic: (Choose one) The value of the test statistic: (Round to at least three decimal places.) The pvalun: (Round to at least three decimal places,) LejBmhs?ToBwW/QYjlbavbSPXtx-YCjsh_7 O CHI-SQUARE TESTS, INFERENCES FOR REGRESSION, AND ANOVA Hypothesis tests for the correlation coefficient and the slope of.. Emmanuel V 1.40. (9 :U.S. Bureau of Economic Analysis, Survey of Current Business, May 2000). Based on this information, test for a significant linear relationship between the variables x and y by doing a hypothesis test regarding the population slope B,. (Assume that the variable y follows a normal distribution for each value of x and that the other regression assumptions are satisfied.) Use the 0.10 level of significance, and perform a two-tailed test. Then fill in the table below. (If necessary, consult a list of formulas.) Aa The null hypothesis: H :0 The alternative hypothesis: Co D=D s The type of test statistic: (Choose one) # O D The value of the test statistic: (Round to at least three decimal places.) The p-value: (Round to at least three decimal places.) Based on the data, can we conclude (using the 0.10 level) that there is a significant linear relationship between 1980 per capita income and 1999 per capita income for U.S. states? O Yes O No Explanation Check 2020 McGraw-Hill Education All Rights Reserved. Terms of Use | Privacy | Accessibility Type here to search
Step by Step Solution
3.41 Rating (145 Votes )
There are 3 Steps involved in it

Get step-by-step solutions from verified subject matter experts