

Question: Please include Excel spreadsheet formulations. The graph in Figure 5.38 represents various flows that can occur through a sewage treatment plant with the numbers on
Please include Excel spreadsheet formulations.
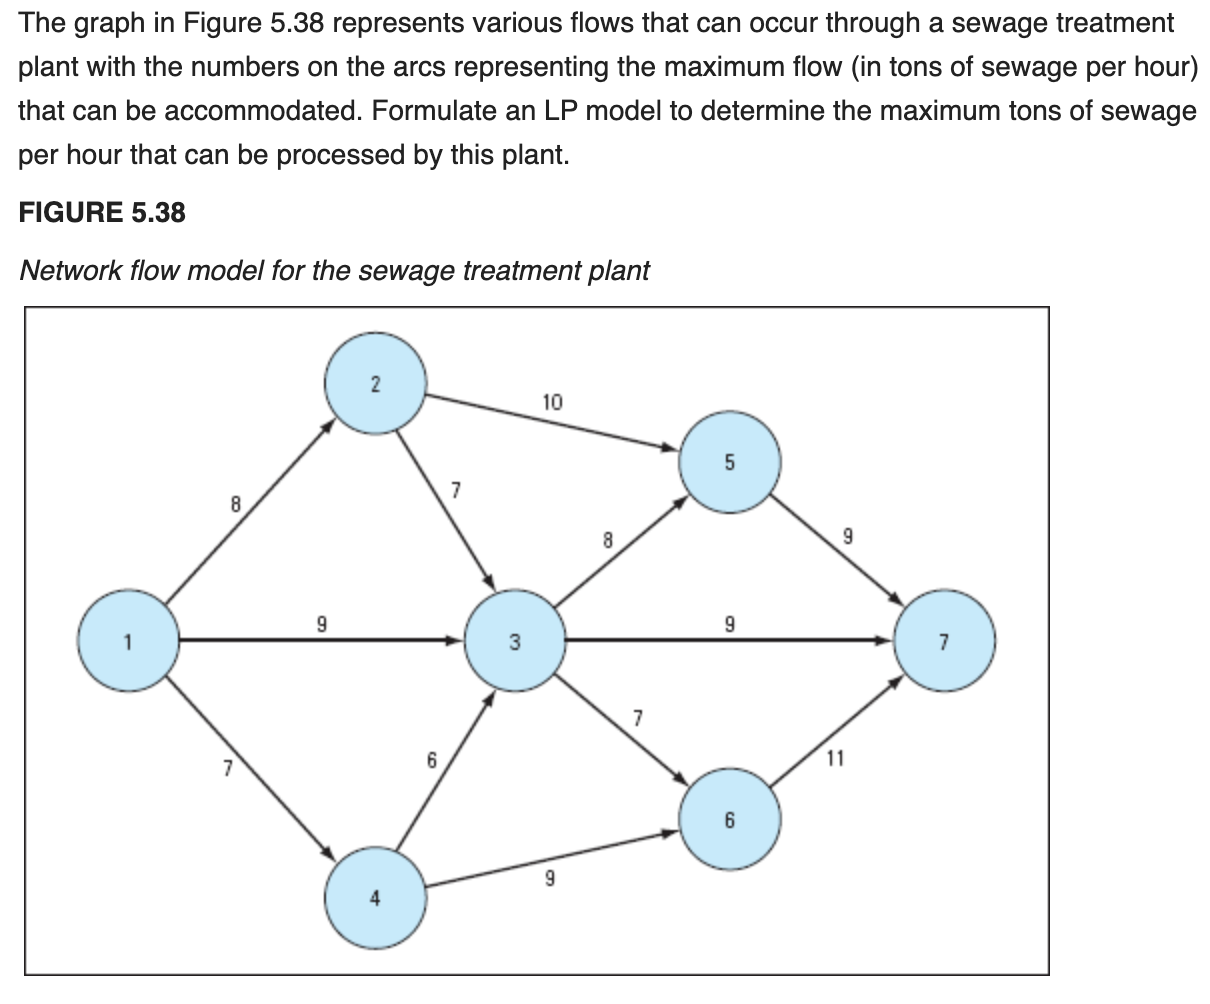
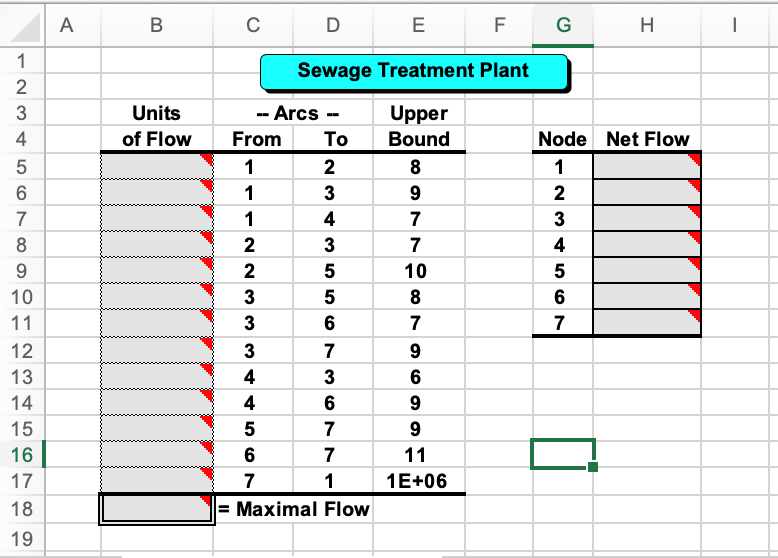
The graph in Figure 5.38 represents various flows that can occur through a sewage treatment plant with the numbers on the arcs representing the maximum flow (in tons of sewage per hour) that can be accommodated. Formulate an LP model to determine the maximum tons of sewage per hour that can be processed by this plant. FIGURE 5.38 Network flow model for the sewage treatment plant 2 10 7 8 8 9 9 9 3 7 7 7 6 11 6 9 A B D E F G . Sewage Treatment Plant Units of Flow 1 2 3 4 5 6 7 8 9 10 11 12 13 14 15 16 17 18 19 -- Arcs -- From To 1 2 1 3 1 4 2 3 2 5 3 5 3 6 3 7 4 3 4 6 5 7 6 7 7 1 = Maximal Flow Upper Bound 8 9 7 7 10 8 7 9 6 9 9 11 1E+06 Node Net Flow 1 2 3 4 5 6 7Step by Step Solution
There are 3 Steps involved in it
1 Expert Approved Answer
Step: 1 Unlock

Question Has Been Solved by an Expert!
Get step-by-step solutions from verified subject matter experts
Step: 2 Unlock
Step: 3 Unlock