

Question: Using Aanlytic Solver In Excel Solve: The graph in Figure 5 . 3 8 represents various flows that can occur through a sewage treatment plant
Using Aanlytic Solver In Excel Solve:
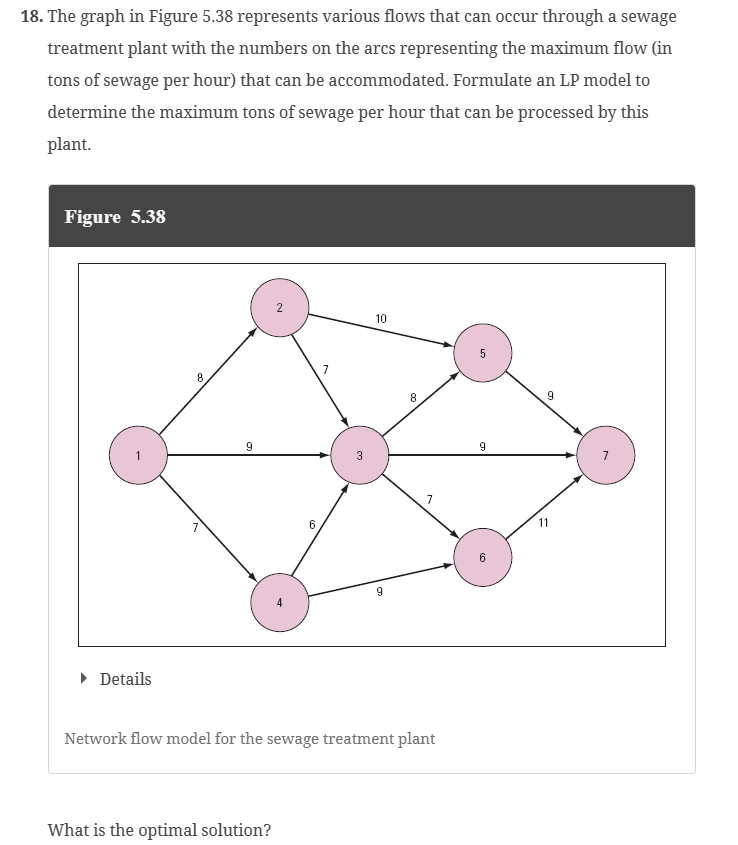
The graph in Figure represents various flows that can occur through a sewage
treatment plant with the numbers on the arcs representing the maximum flow in
tons of sewage per hour that can be accommodated. Formulate an LP model to
determine the maximum tons of sewage per hour that can be processed by this
plant.
Figure
Details
Network flow model for the sewage treatment plant
What is the optimal solution?
Step by Step Solution
There are 3 Steps involved in it
1 Expert Approved Answer
Step: 1 Unlock

Question Has Been Solved by an Expert!
Get step-by-step solutions from verified subject matter experts
Step: 2 Unlock
Step: 3 Unlock