

Question: Please include formulas D M N 0 CVP Model and Budget DIRECTIONS: = Part B. Preparation of sales and muchase budget: Part A. CVP analysis:
Please include formulas
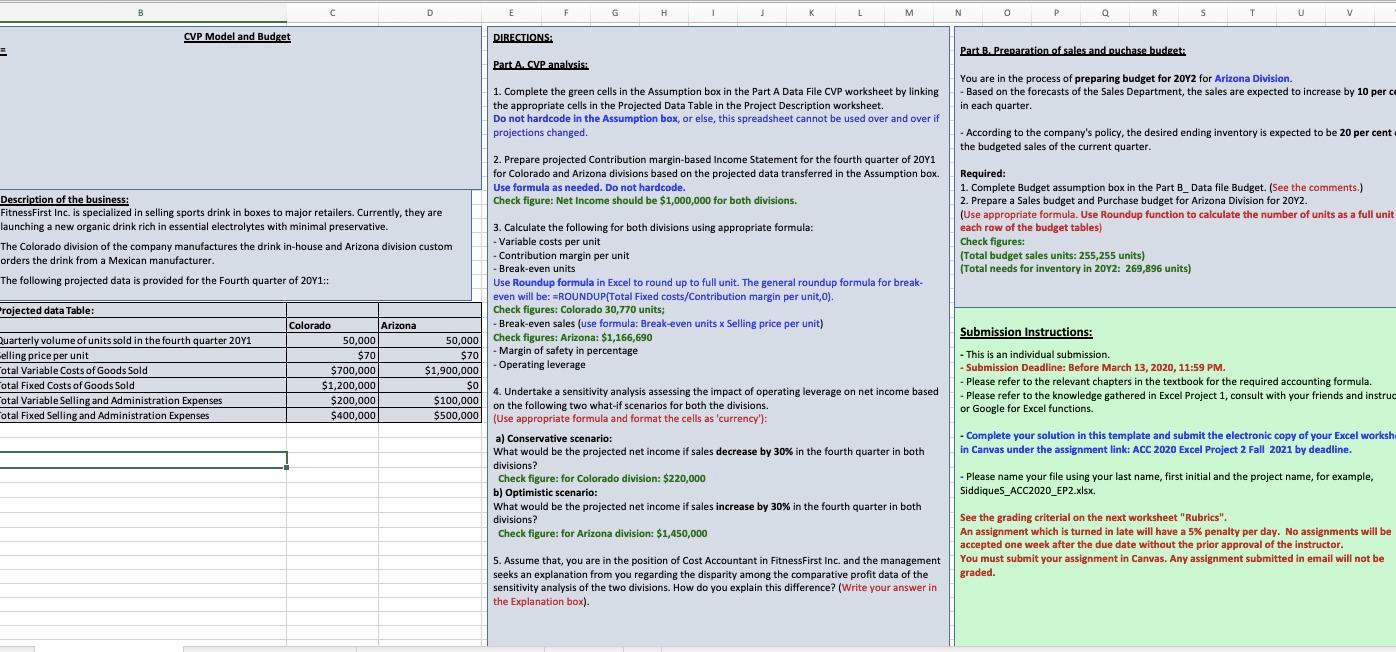
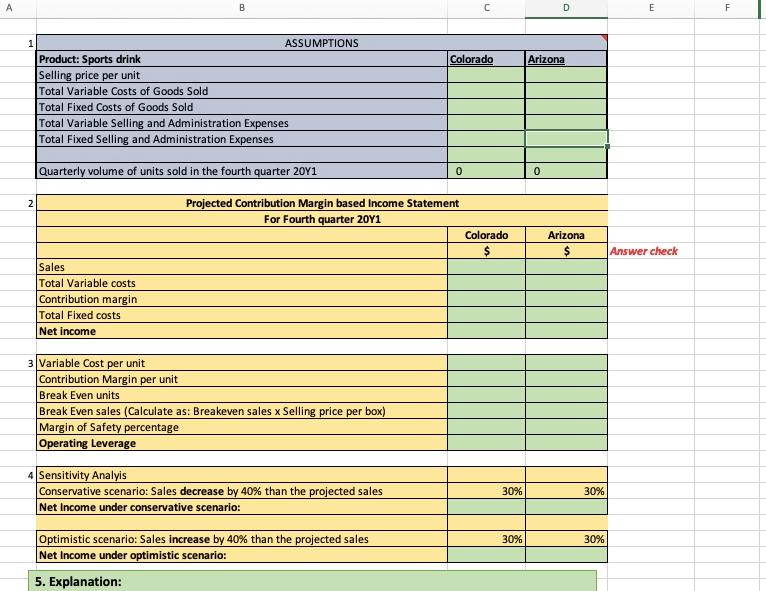
D M N 0 CVP Model and Budget DIRECTIONS: = Part B. Preparation of sales and muchase budget: Part A. CVP analysis: You are in the process of preparing budget for 20Y2 for Arizona Division. 1. Complete the green cells in the Assumption box in the Part A Data File CVP worksheet by linking || - Based on the forecasts of the Sales Department, the sales are expected to increase by 10 perc the appropriate cells in the Projected Data Table in the Project Description worksheet. in each quarter. Do not hardcode in the Assumption box, or else, this spreadsheet cannot be used over and over if projections changed. - According to the company's policy, the desired ending inventory is expected to be 20 per cent , the budgeted sales of the current quarter. 2. Prepare projected Contribution margin-based Income Statement for the fourth quarter of 20Y1 for Colorado and Arizona divisions based on the projected data transferred in the Assumption box. Required: Use formula as needed. Do not hardcode. 1. Complete Budget assumption box in the Part B_Data file Budget. (See the comments.) Description of the business: Check figure: Net Income should be $1,000,000 for both divisions. 2. Prepare a Sales budget and Purchase budget for Arizona Division for 2012. Fitness First Inc. is specialized in selling sports drink in boxes to major retailers. Currently, they are (Use appropriate formula. Use Roundup function to calculate the number of units as a full unit launching a new organic drink rich in essential electrolytes with minimal preservative. 3. Calculate the following for both divisions using appropriate formula: each row of the budget tables) The Colorado division of the company manufactures the drink in-house and Arizona division custom Variable costs per unit Check figures: orders the drink from a Mexican manufacturer. Contribution margin per unit (Total budget sales units: 255,255 units) Break-even units (Total needs for inventory in 2022: 269,896 units) The following projected data is provided for the Fourth quarter of 2041:: Use Roundup formula in Excel to round up to full unit. The general roundup formula for break- even will be: =ROUNDUP(Total Fixed costs/Contribution margin per unit,o). Projected data Table: Check figures: Colorado 30,770 units; Colorado Arizona - Break-even sales (use formula: Break-even units x Selling price per unit) Quarterly volume of units sold in the fourth quarter 20Y1 Submission Instructions: 50,000 50,000 Check figures: Arizona: $1,166,690 elling price per unit $70 $70 Margin of safety in percentage - This is an individual submission. Total Variable Costs of Goods Sold $700,000 Operating leverage $1,900,000 Submission Deadline: Before March 13, 2020, 11:59 PM. Cotal Fixed Costs of Goods Sold $1,200,000 $0 0 - Please refer to the relevant chapters in the textbook for the required accounting formula. 4. Undertake a sensitivity analysis assessing the impact of operating leverage on net income based otal Variable Selling and Administration Expenses $200,000 $100,000 - Please refer to the knowledge gathered in Excel Project 1, consult with your friends and instruc on the following two what-if scenarios for both the divisions. otal Fixed Selling and Administration Expenses or Google for Excel functions. $400,000 $500,000 (Use appropriate formula and format the cells as 'currency'): a) Conservative scenario: - Complete your solution in this template and submit the electronic copy of your Excel worksh What would be the projected net income if sales decrease by 30% in the fourth quarter in both in Canvas under the assignment link: ACC 2020 Excel Project 2 Fall 2021 by deadline. divisions? Check figure: for Colorado division: $220,000 - Please name your file using your last name, first initial and the project name, for example, b) Optimistic scenario: Siddiques_ACC2020_EP2.xlsx. What would be the projected net income if sales increase by 30% in the fourth quarter in both divisions? See the grading criterial on the next worksheet "Rubrics". Check figure: for Arizona division: $1,450,000 An assignment which is turned in late will have a 5% penalty per day. No assignments will be accepted one week after the due date without the prior approval of the instructor. 5. Assume that you are in the position of Cost Accountant in Fitness First Inc. and the management , You must submit your assignment in Canvas. Any assignment submitted in email will not be seeks an explanation from you regarding the disparity among the comparative profit data of the graded. sensitivity analysis of the two divisions. How do you explain this difference? (Write your answer in the Explanation box). B C D E F 1 Colorado Arizona ASSUMPTIONS Product: Sports drink Selling price per unit Total Variable costs of Goods Sold Total Fixed Costs of Goods Sold Total Variable Selling and Administration Expenses Total Fixed Selling and Administration Expenses Quarterly volume of units sold in the fourth quarter 2011 0 0 2 Projected Contribution Margin based Income Statement For Fourth quarter 20Y1 Colorado $ Arizona Answer check Sales Total Variable costs Contribution margin Total Fixed costs Net income 3 Variable Cost per unit Contribution Margin per unit Break Even units Break Even sales (Calculate as: Breakeven sales x Selling price per box) Margin of Safety percentage Operating Leverage 4 Sensitivity Analyis Conservative scenario: Sales decrease by 40% than the projected sales Net Income under conservative scenario: 30% 30% 30% 30% Optimistic scenario: Sales increase by 40% than the projected sales Net Income under optimistic scenario: 5. Explanation: D M N 0 CVP Model and Budget DIRECTIONS: = Part B. Preparation of sales and muchase budget: Part A. CVP analysis: You are in the process of preparing budget for 20Y2 for Arizona Division. 1. Complete the green cells in the Assumption box in the Part A Data File CVP worksheet by linking || - Based on the forecasts of the Sales Department, the sales are expected to increase by 10 perc the appropriate cells in the Projected Data Table in the Project Description worksheet. in each quarter. Do not hardcode in the Assumption box, or else, this spreadsheet cannot be used over and over if projections changed. - According to the company's policy, the desired ending inventory is expected to be 20 per cent , the budgeted sales of the current quarter. 2. Prepare projected Contribution margin-based Income Statement for the fourth quarter of 20Y1 for Colorado and Arizona divisions based on the projected data transferred in the Assumption box. Required: Use formula as needed. Do not hardcode. 1. Complete Budget assumption box in the Part B_Data file Budget. (See the comments.) Description of the business: Check figure: Net Income should be $1,000,000 for both divisions. 2. Prepare a Sales budget and Purchase budget for Arizona Division for 2012. Fitness First Inc. is specialized in selling sports drink in boxes to major retailers. Currently, they are (Use appropriate formula. Use Roundup function to calculate the number of units as a full unit launching a new organic drink rich in essential electrolytes with minimal preservative. 3. Calculate the following for both divisions using appropriate formula: each row of the budget tables) The Colorado division of the company manufactures the drink in-house and Arizona division custom Variable costs per unit Check figures: orders the drink from a Mexican manufacturer. Contribution margin per unit (Total budget sales units: 255,255 units) Break-even units (Total needs for inventory in 2022: 269,896 units) The following projected data is provided for the Fourth quarter of 2041:: Use Roundup formula in Excel to round up to full unit. The general roundup formula for break- even will be: =ROUNDUP(Total Fixed costs/Contribution margin per unit,o). Projected data Table: Check figures: Colorado 30,770 units; Colorado Arizona - Break-even sales (use formula: Break-even units x Selling price per unit) Quarterly volume of units sold in the fourth quarter 20Y1 Submission Instructions: 50,000 50,000 Check figures: Arizona: $1,166,690 elling price per unit $70 $70 Margin of safety in percentage - This is an individual submission. Total Variable Costs of Goods Sold $700,000 Operating leverage $1,900,000 Submission Deadline: Before March 13, 2020, 11:59 PM. Cotal Fixed Costs of Goods Sold $1,200,000 $0 0 - Please refer to the relevant chapters in the textbook for the required accounting formula. 4. Undertake a sensitivity analysis assessing the impact of operating leverage on net income based otal Variable Selling and Administration Expenses $200,000 $100,000 - Please refer to the knowledge gathered in Excel Project 1, consult with your friends and instruc on the following two what-if scenarios for both the divisions. otal Fixed Selling and Administration Expenses or Google for Excel functions. $400,000 $500,000 (Use appropriate formula and format the cells as 'currency'): a) Conservative scenario: - Complete your solution in this template and submit the electronic copy of your Excel worksh What would be the projected net income if sales decrease by 30% in the fourth quarter in both in Canvas under the assignment link: ACC 2020 Excel Project 2 Fall 2021 by deadline. divisions? Check figure: for Colorado division: $220,000 - Please name your file using your last name, first initial and the project name, for example, b) Optimistic scenario: Siddiques_ACC2020_EP2.xlsx. What would be the projected net income if sales increase by 30% in the fourth quarter in both divisions? See the grading criterial on the next worksheet "Rubrics". Check figure: for Arizona division: $1,450,000 An assignment which is turned in late will have a 5% penalty per day. No assignments will be accepted one week after the due date without the prior approval of the instructor. 5. Assume that you are in the position of Cost Accountant in Fitness First Inc. and the management , You must submit your assignment in Canvas. Any assignment submitted in email will not be seeks an explanation from you regarding the disparity among the comparative profit data of the graded. sensitivity analysis of the two divisions. How do you explain this difference? (Write your answer in the Explanation box). B C D E F 1 Colorado Arizona ASSUMPTIONS Product: Sports drink Selling price per unit Total Variable costs of Goods Sold Total Fixed Costs of Goods Sold Total Variable Selling and Administration Expenses Total Fixed Selling and Administration Expenses Quarterly volume of units sold in the fourth quarter 2011 0 0 2 Projected Contribution Margin based Income Statement For Fourth quarter 20Y1 Colorado $ Arizona Answer check Sales Total Variable costs Contribution margin Total Fixed costs Net income 3 Variable Cost per unit Contribution Margin per unit Break Even units Break Even sales (Calculate as: Breakeven sales x Selling price per box) Margin of Safety percentage Operating Leverage 4 Sensitivity Analyis Conservative scenario: Sales decrease by 40% than the projected sales Net Income under conservative scenario: 30% 30% 30% 30% Optimistic scenario: Sales increase by 40% than the projected sales Net Income under optimistic scenario: 5. Explanation
Step by Step Solution
There are 3 Steps involved in it

Get step-by-step solutions from verified subject matter experts