

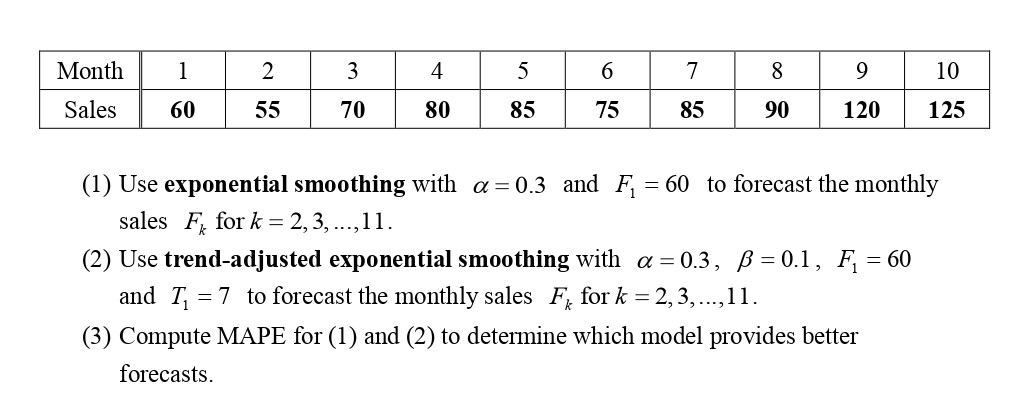
Question: Please include line chart OR time series plot for Question 3. Provide MSE,MAD and MAPE Month Sales 1 60 2 55 3 70 4 80
Please include line chart OR time series plot for Question 3.
Provide MSE,MAD and MAPE
Step by Step Solution
There are 3 Steps involved in it
1 Expert Approved Answer
Step: 1 Unlock

Question Has Been Solved by an Expert!
Get step-by-step solutions from verified subject matter experts
Step: 2 Unlock
Step: 3 Unlock