

Question: Please include table and graph, with at least 50 data points, along with brief detailed explanations of each step. Thank you. 2) (40 points) On
Please include table and graph, with at least 50 data points, along with brief detailed explanations of each step. Thank you.
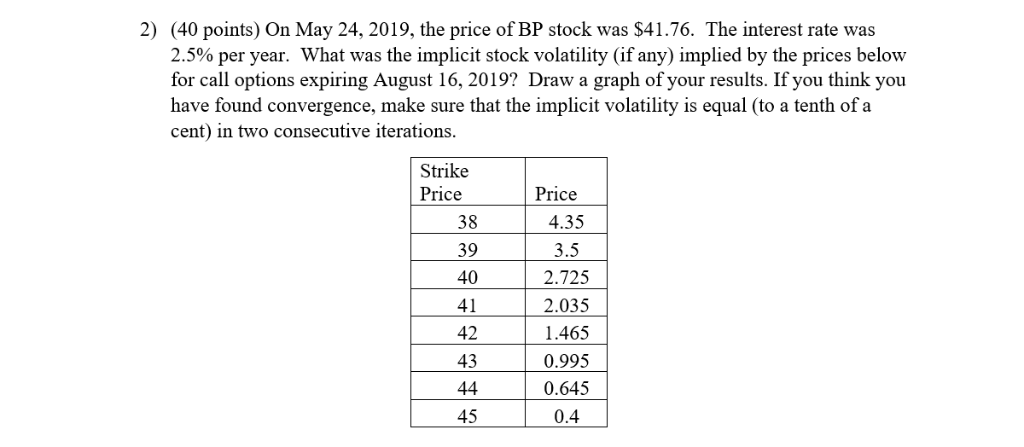
2) (40 points) On May 24, 2019, the price of BP stock was $41.76. The interest rate was 2.5% per year. What was the implicit stock volatility (if any) implied by the prices below for call options expiring August 16, 2019? Draw a graph of your results. If you think you have found convergence, make sure that the implicit volatility is equal (to a tenth of a cent) in two consecutive iterations. Strike Price 38 39 Price 4.35 3.5 2.725 2.035 1.465 0.995 0.645 0.4 2) (40 points) On May 24, 2019, the price of BP stock was $41.76. The interest rate was 2.5% per year. What was the implicit stock volatility (if any) implied by the prices below for call options expiring August 16, 2019? Draw a graph of your results. If you think you have found convergence, make sure that the implicit volatility is equal (to a tenth of a cent) in two consecutive iterations. Strike Price 38 39 Price 4.35 3.5 2.725 2.035 1.465 0.995 0.645 0.4
Step by Step Solution
There are 3 Steps involved in it

Get step-by-step solutions from verified subject matter experts