

Question: Please include what you did on excel to get your answers as well. lease Questions 1 Complete table 11.1 by computing total monthly expenses, y.t.d.
Please include what you did on excel to get your answers as well.
 lease
lease
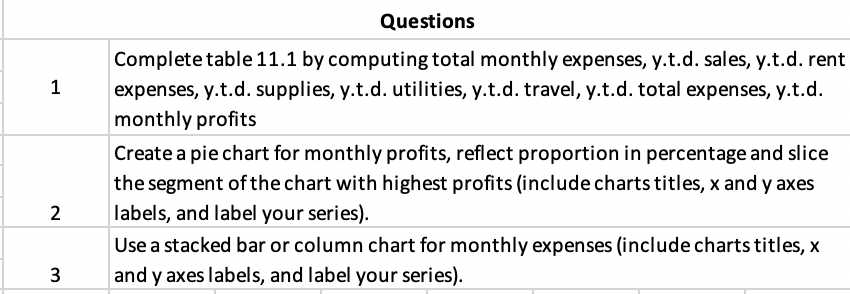
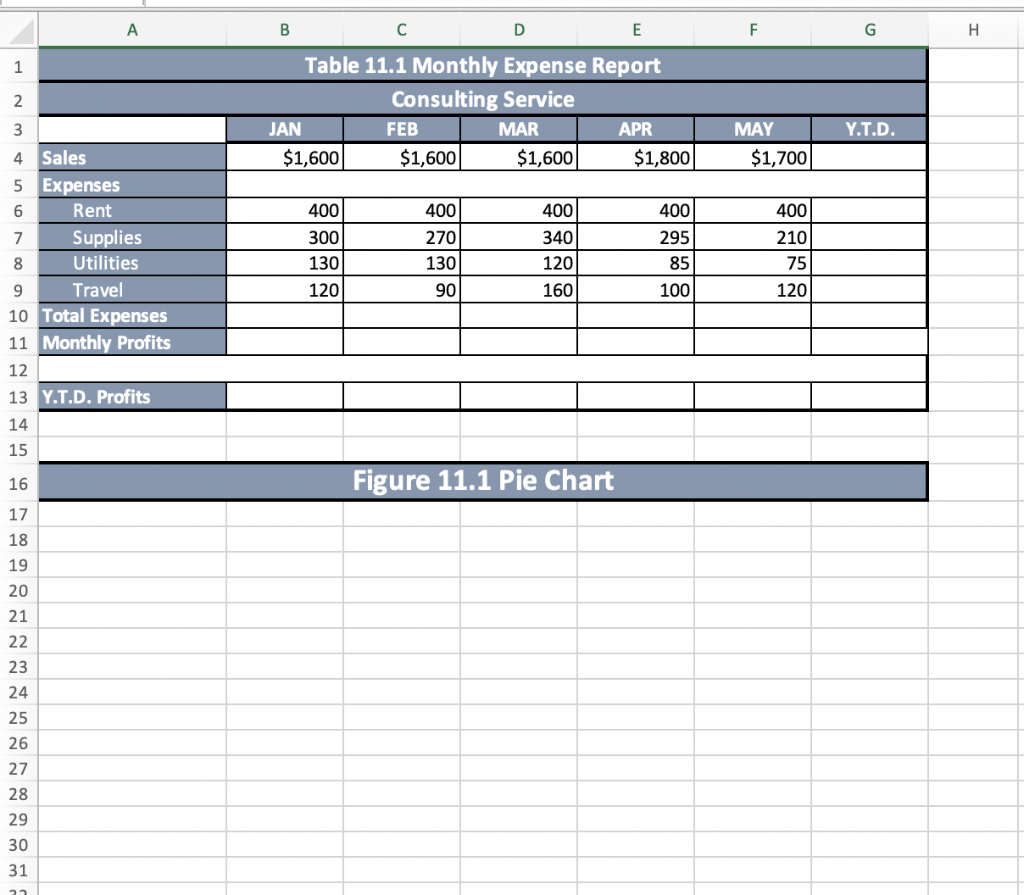
Questions 1 Complete table 11.1 by computing total monthly expenses, y.t.d. sales, y.t.d. rent expenses, y.t.d. supplies, y.t.d. utilities, y.t.d. travel, y.t.d. total expenses, y.t.d. monthly profits Create a pie chart for monthly profits, reflect proportion in percentage and slice the segment of the chart with highest profits (include charts titles, x and y axes labels, and label your series). Use a stacked bar or column chart for monthly expenses (include charts titles, X and y axes labels, and label your series). 2 3 A B C D E F G H 1 2 Table 11.1 Monthly Expense Report Consulting Service JAN FEB MAR APR $1,600 $1,600 $1,600 $1,800 3 Y.T.D. MAY $1,700 400 300 130 120 400 270 130 90 400 340 120 160 400 295 85 100 400 210 75 120 4 Sales 5 Expenses 6 Rent 7 Supplies 8 Utilities 9 Travel 10 Total Expenses 11 Monthly Profits 12 13 Y.T.D. Profits 14 15 16 Figure 11.1 Pie Chart 17 18 19 20 21 22 23 24 25 26 27 28 29 30 31 32 33 Figure 11.2 Stacked Bar OR Column Chart 34 35 36 37 38 39 40 41 42 43 44 45 46 47 48 49 50 51 52 53 54 55 Questions 1 Complete table 11.1 by computing total monthly expenses, y.t.d. sales, y.t.d. rent expenses, y.t.d. supplies, y.t.d. utilities, y.t.d. travel, y.t.d. total expenses, y.t.d. monthly profits Create a pie chart for monthly profits, reflect proportion in percentage and slice the segment of the chart with highest profits (include charts titles, x and y axes labels, and label your series). Use a stacked bar or column chart for monthly expenses (include charts titles, X and y axes labels, and label your series). 2 3 A B C D E F G H 1 2 Table 11.1 Monthly Expense Report Consulting Service JAN FEB MAR APR $1,600 $1,600 $1,600 $1,800 3 Y.T.D. MAY $1,700 400 300 130 120 400 270 130 90 400 340 120 160 400 295 85 100 400 210 75 120 4 Sales 5 Expenses 6 Rent 7 Supplies 8 Utilities 9 Travel 10 Total Expenses 11 Monthly Profits 12 13 Y.T.D. Profits 14 15 16 Figure 11.1 Pie Chart 17 18 19 20 21 22 23 24 25 26 27 28 29 30 31 32 33 Figure 11.2 Stacked Bar OR Column Chart 34 35 36 37 38 39 40 41 42 43 44 45 46 47 48 49 50 51 52 53 54 55
Step by Step Solution
There are 3 Steps involved in it
1 Expert Approved Answer
Step: 1 Unlock

Question Has Been Solved by an Expert!
Get step-by-step solutions from verified subject matter experts
Step: 2 Unlock
Step: 3 Unlock