

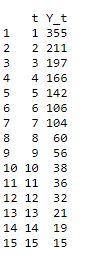
Question: Please include your Code, must be done in R tyt 1 1 355 2 2 211 3 3 197 4 4 166 5 5 142
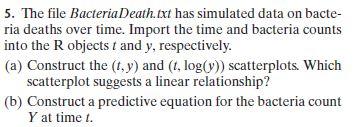
Please include your Code, must be done in R
Step by Step Solution
There are 3 Steps involved in it
1 Expert Approved Answer
Step: 1 Unlock

Question Has Been Solved by an Expert!
Get step-by-step solutions from verified subject matter experts
Step: 2 Unlock
Step: 3 Unlock