

Question: Please interpret SPSS statistics fDescriptive Statistics N Minimum Maximum Mean Std. Deviation Skewness Statistic Statistic Statistic Statistic Statistic Statistic Income Inequality 168 25.50 63.40 38.7935
Please interpret SPSS statistics
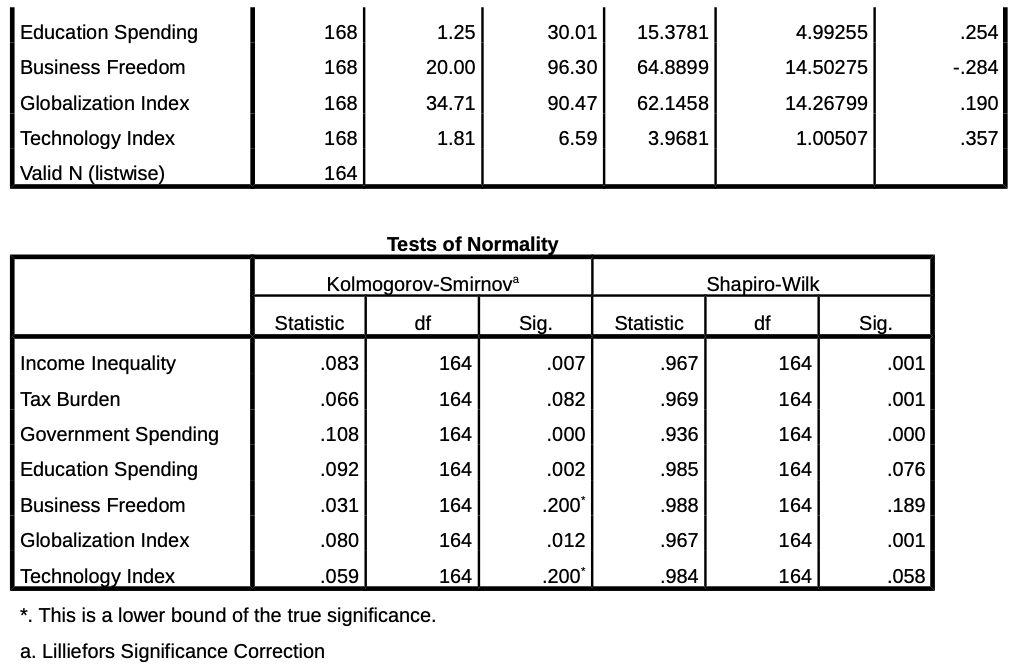
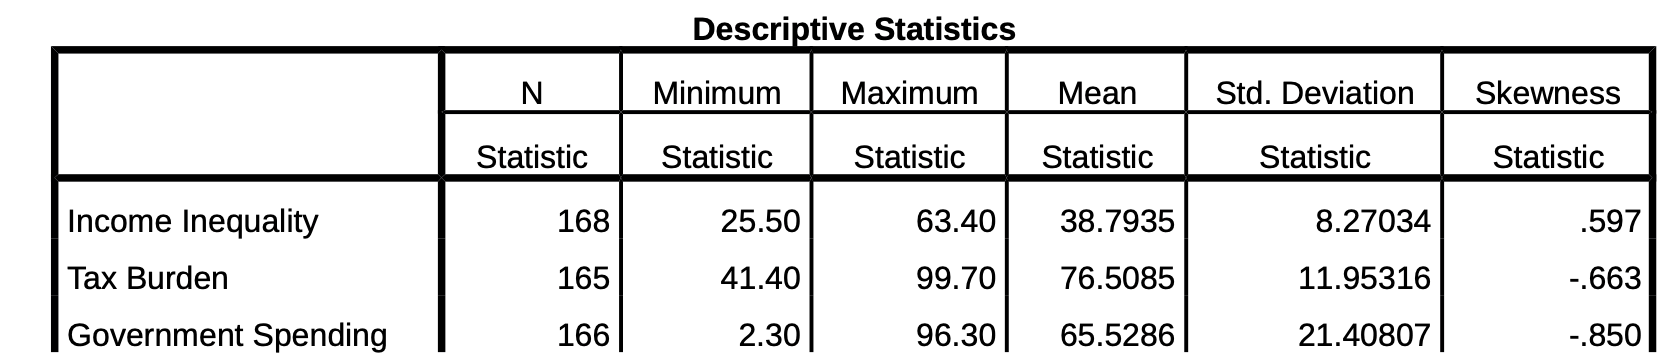
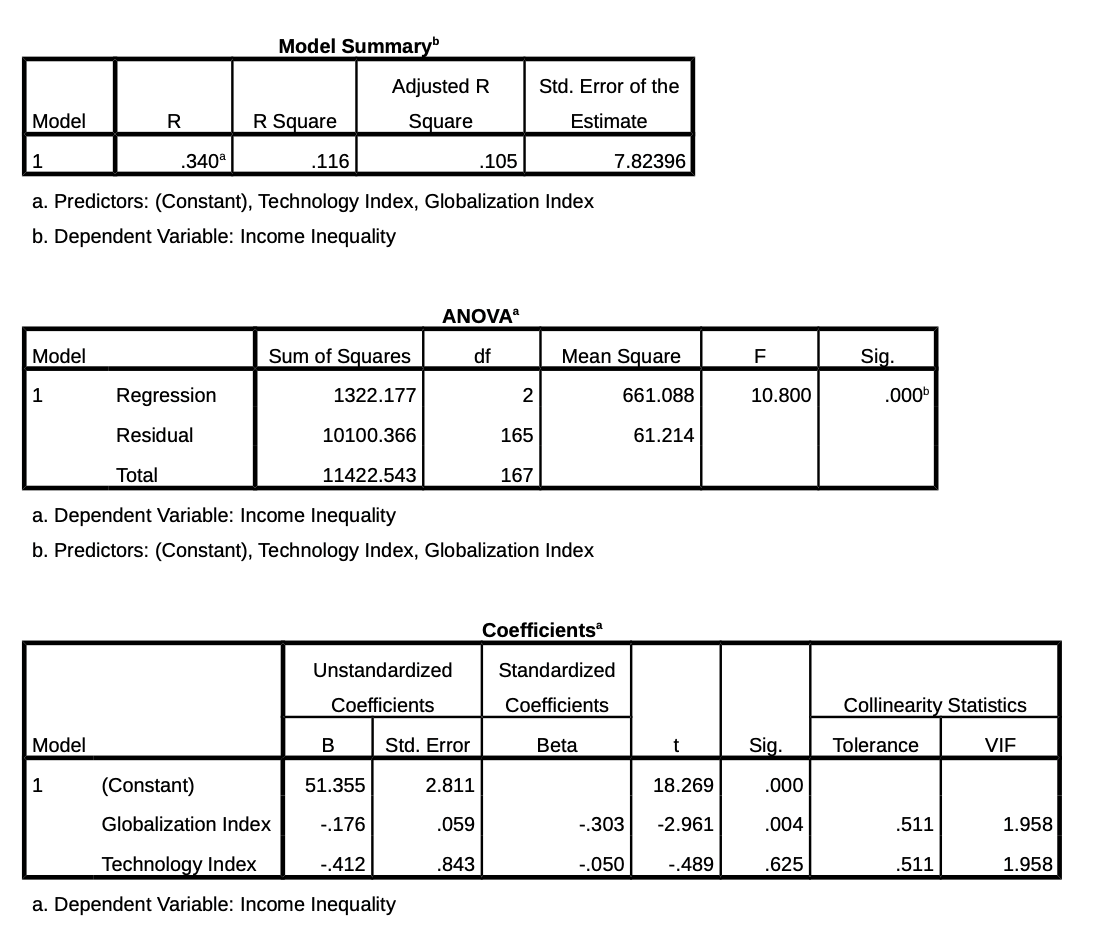
\fDescriptive Statistics N Minimum Maximum Mean Std. Deviation Skewness Statistic Statistic Statistic Statistic Statistic Statistic Income Inequality 168 25.50 63.40 38.7935 8.27034 .597 Tax Burden 165 41.40 99.70 76.5085 11.95316 -.663 Government Spending 166 2.30 96.30 65.5286 21.40807 -.850Model Summaryb Adjusted R Std. Error of the Model R R Square Square Estimate 340a .116 .105 7.82396 a. Predictors: (Constant), Technology Index, Globalization Index b. Dependent Variable: Income Inequality ANOVA Model Sum of Squares df Mean Square F Sig. 1 Regression 1322.177 2 661.088 10.800 000 Residual 10100.366 165 61.214 Total 11422.543 167 a. Dependent Variable: Income Inequality b. Predictors: (Constant), Technology Index, Globalization Index Coefficients Unstandardized Standardized Coefficients Coefficients Collinearity Statistics Model B Std. Error Beta Sig Tolerance VIF (Constant) 51.355 2.811 18.269 000 Globalization Index -.176 .059 -.303 -2.961 004 .511 1.958 Technology Index -.412 843 -.050 .489 625 511 1.958 a. Dependent Variable: Income Inequality
Step by Step Solution
There are 3 Steps involved in it

Get step-by-step solutions from verified subject matter experts