

Question: Please let me know if you are able to do this project for me. I will pay $$$. My email is bhamilia24 at geemail dot
Please let me know if you are able to do this project for me. I will pay $$$. My email is bhamilia24 at geemail dot com. I had to spell my email differently but please use common sense. Email me for more information and to discuss further. The subject is stock trend analysis. 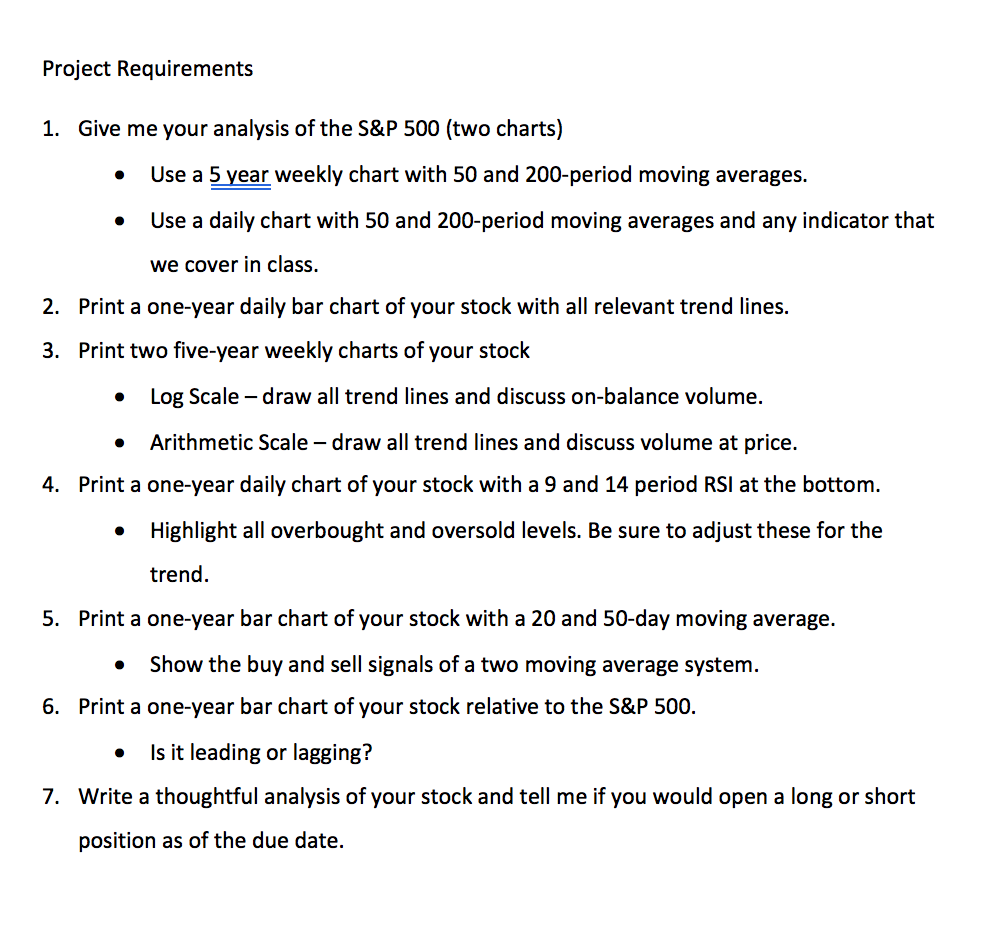
Project Requirements 1. Give me your analysis of the S&P 500 (two charts) Use a 5 year weekly chart with 50 and 200-period moving averages. . Use a daily chart with 50 and 200-period moving averages and any indicator that we cover in class. 2. Print a one-year daily bar chart of your stock with all relevant trend lines. 3. Print two five-year weekly charts of your stock Log Scale - draw all trend lines and discuss on-balance volume. Arithmetic Scale - draw all trend lines and discuss volume at price. 4. Print a one-year daily chart of your stock with a 9 and 14 period RSI at the bottom. Highlight all overbought and oversold levels. Be sure to adjust these for the . trend. 5. Print a one-year bar chart of your stock with a 20 and 50-day moving average. Show the buy and sell signals of a two moving average system. 6. Print a one-year bar chart of your stock relative to the S&P 500. Is it leading or lagging? 7. Write a thoughtful analysis of your stock and tell me if you would open a long or short position as of the due date. Project Requirements 1. Give me your analysis of the S&P 500 (two charts) Use a 5 year weekly chart with 50 and 200-period moving averages. . Use a daily chart with 50 and 200-period moving averages and any indicator that we cover in class. 2. Print a one-year daily bar chart of your stock with all relevant trend lines. 3. Print two five-year weekly charts of your stock Log Scale - draw all trend lines and discuss on-balance volume. Arithmetic Scale - draw all trend lines and discuss volume at price. 4. Print a one-year daily chart of your stock with a 9 and 14 period RSI at the bottom. Highlight all overbought and oversold levels. Be sure to adjust these for the . trend. 5. Print a one-year bar chart of your stock with a 20 and 50-day moving average. Show the buy and sell signals of a two moving average system. 6. Print a one-year bar chart of your stock relative to the S&P 500. Is it leading or lagging? 7. Write a thoughtful analysis of your stock and tell me if you would open a long or short position as of the due date
Step by Step Solution
There are 3 Steps involved in it

Get step-by-step solutions from verified subject matter experts