

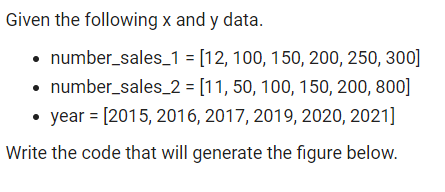
Question: (please make it as simple as possible) Given the following x and y data. number_sales_1 = [12, 100, 150, 200, 250, 300] number_sales_2 = [11,
(please make it as simple as possible)
![and y data. number_sales_1 = [12, 100, 150, 200, 250, 300] number_sales_2](https://dsd5zvtm8ll6.cloudfront.net/si.experts.images/questions/2024/09/66f518579f22b_58366f518574d0e7.jpg)
Given the following x and y data. number_sales_1 = [12, 100, 150, 200, 250, 300] number_sales_2 = [11, 50, 100, 150, 200, 800] year = [2015, 2016, 2017, 2019, 2020, 2021] Write the code that will generate the figure below. number_sales_1 number_sales_2
Step by Step Solution
There are 3 Steps involved in it
1 Expert Approved Answer
Step: 1 Unlock

Question Has Been Solved by an Expert!
Get step-by-step solutions from verified subject matter experts
Step: 2 Unlock
Step: 3 Unlock