

Question: solve using Python . Given the following x and y data. number_sales_1 = [12, 100, 150, 200, 250, 300] number_sales_2 = [11, 50, 100, 150,
solve using Python 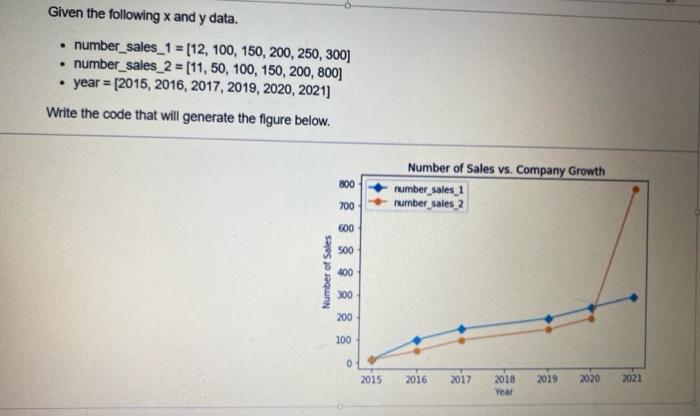
. Given the following x and y data. number_sales_1 = [12, 100, 150, 200, 250, 300] number_sales_2 = [11, 50, 100, 150, 200, 800] year = [2015, 2016, 2017, 2019, 2020, 2021) Write the code that will generate the figure below. 800 Number of Sales vs. Company Growth number sales 1 number_sales_2 700 600 500 Number of Sales 400 300 200 100 0 2015 2016 2017 2019 2020 2021 2018 Year
Step by Step Solution
There are 3 Steps involved in it
1 Expert Approved Answer
Step: 1 Unlock

Question Has Been Solved by an Expert!
Get step-by-step solutions from verified subject matter experts
Step: 2 Unlock
Step: 3 Unlock