

Question: Please make sure your answer is correct and show all your work. c) Can you tell from the figure above whether salmon is a normal

Please make sure your answer is correct and show all your work.


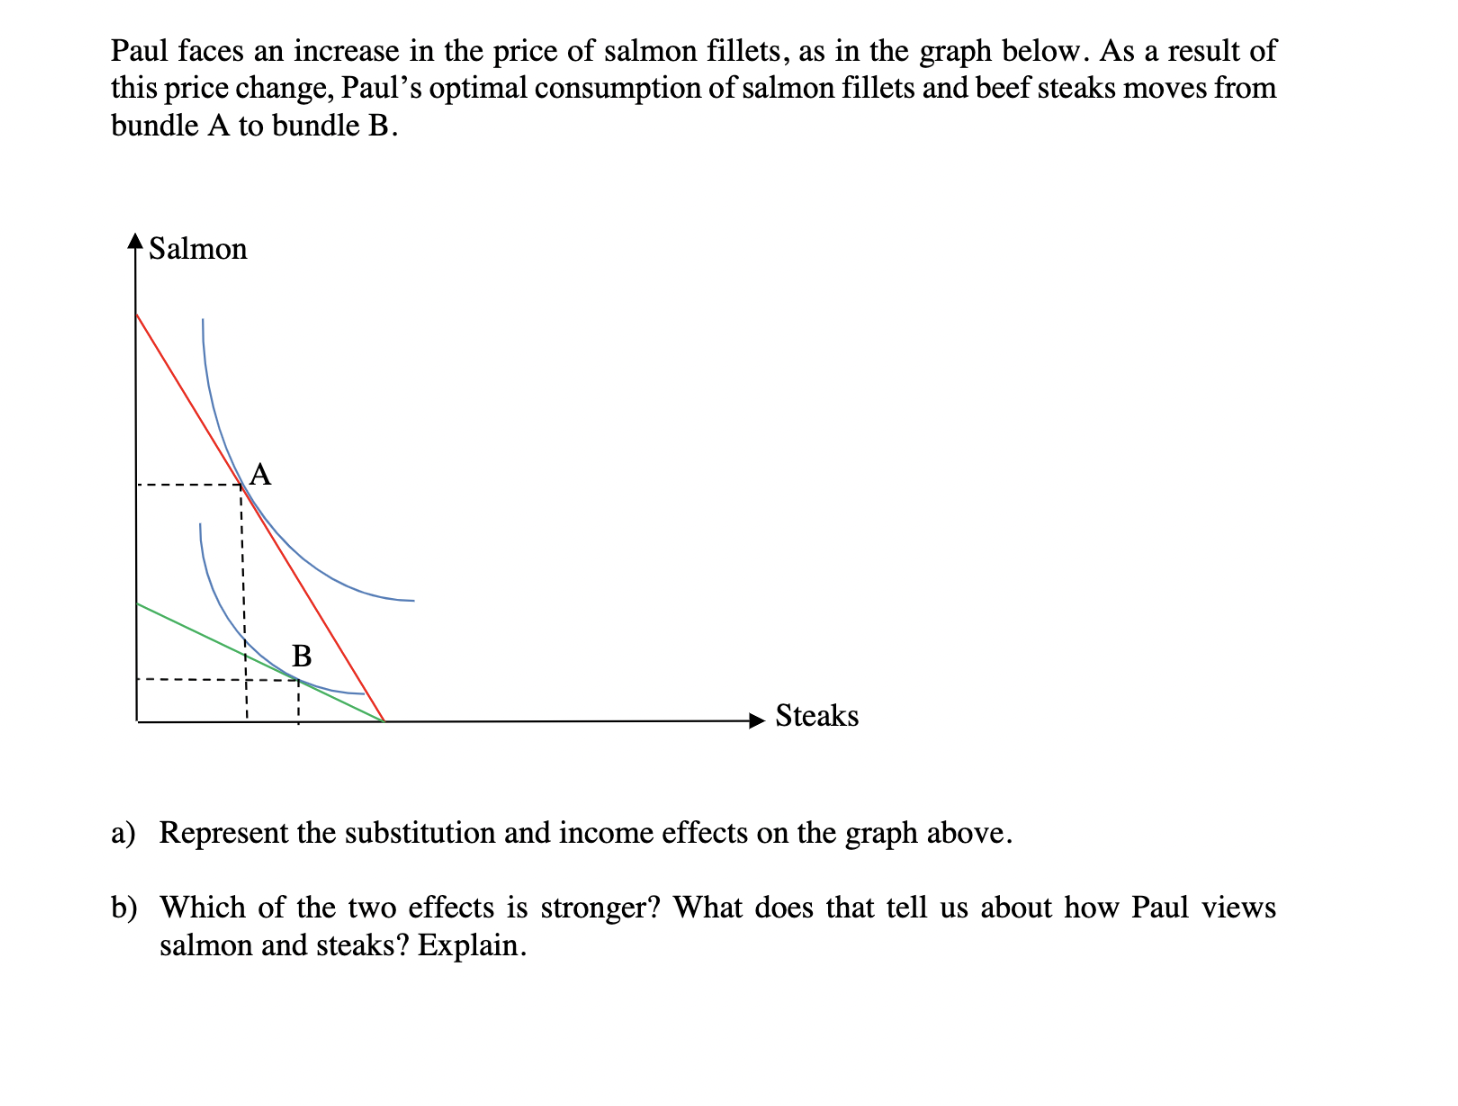
c) Can you tell from the figure above whether salmon is a normal or inferior good for Paul? Explain.Paul faces an increase in the price of salmon fillets, as in the graph below. As a result of this price change, Paul's optimal consumption of salmon fillets and beef steaks moves from bundle A to bundle B. + Salmon A B Steaks a) Represent the substitution and income effects on the graph above. b) Which of the two effects is stronger? What does that tell us about how Paul views salmon and steaks? Explain
Step by Step Solution
There are 3 Steps involved in it
1 Expert Approved Answer
Step: 1 Unlock

Question Has Been Solved by an Expert!
Get step-by-step solutions from verified subject matter experts
Step: 2 Unlock
Step: 3 Unlock