

Question: Please make the chart and give descriptions on how you do it. Requirements 1. Fill in the blanks for each company. 2. Compute breakeven, in
 Please make the chart and give descriptions on how you do it.
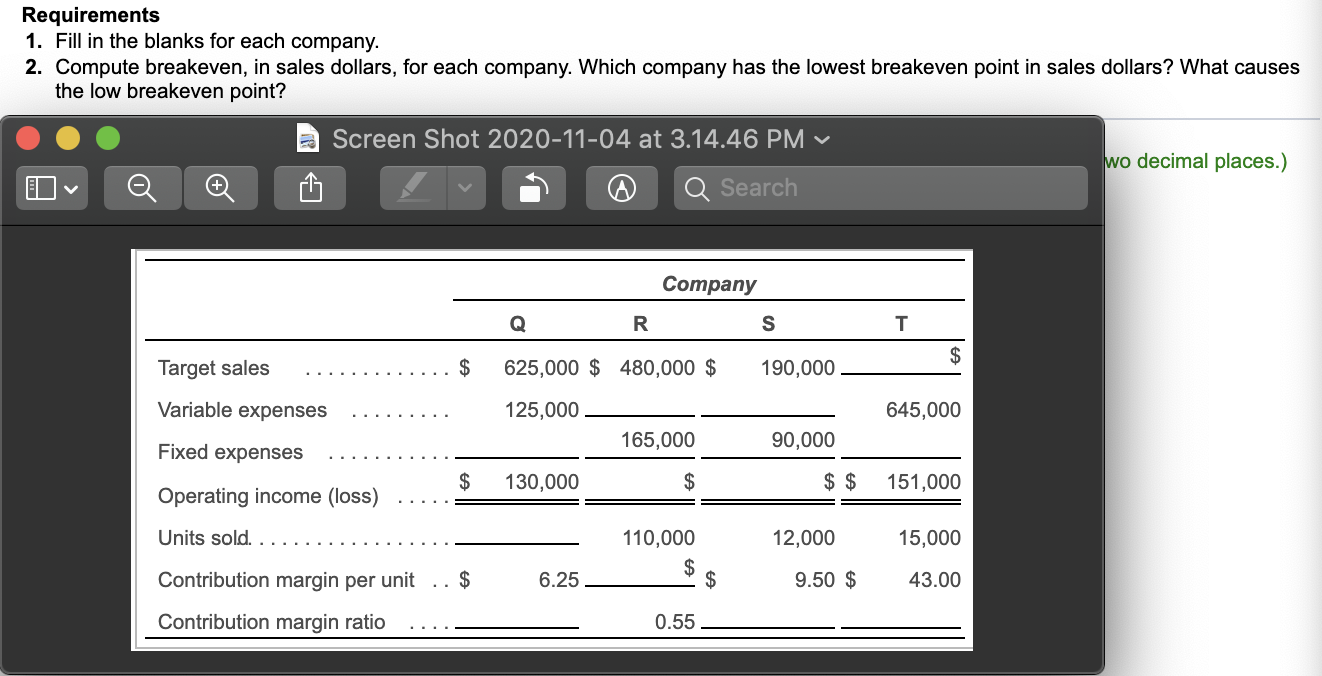
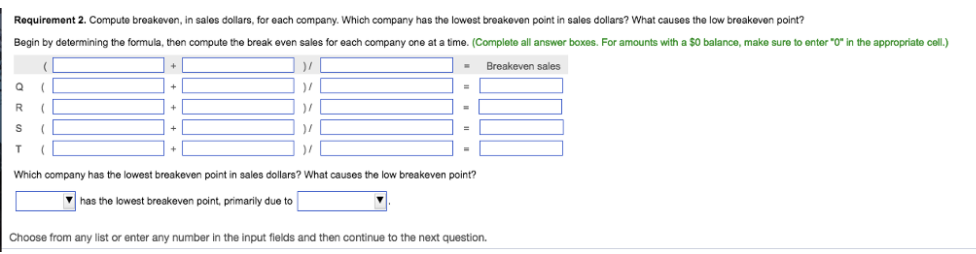
Requirements 1. Fill in the blanks for each company. 2. Compute breakeven, in sales dollars, for each company. Which company has the lowest breakeven point in sales dollars? What causes the low breakeven point? a Screen Shot 2020-11-04 at 3.14.46 PM v wo decimal places.) I Q Q Search Company Q R S T $ Target sales $ 625,000 $ 480,000 $ 190,000 Variable expenses 125,000 645,000 Fixed expenses 165,000 90,000 $ 130,000 $ $ $ 151,000 Operating income (loss) Units sold. 12,000 15,000 110,000 $ $ Contribution margin per unit $ 6.25 9.50 $ 43.00 Contribution margin ratio 0.55 Requirement 2. Compute breakeven, in sales dollars, for each company. Which company has the lowest breakoven point in sales dollars? What causes the low breakeven point? Begin by determining the formula, then compute the break even sales for each company one at a time. (Complete all answer boxes. For amounts with a $0 balance, make sure to enter "o" in the appropriate cell.) + ) Breakeven sales Q ( + )/ R + )4 S ( 17 T ( )4 Which company has the lowest breakeven point in sales dollars? What causes the low breakeven point? has the lowest breakeven point, primarily due to Choose from any list or enter any number in the input fields and then continue the next
Step by Step Solution
There are 3 Steps involved in it

Get step-by-step solutions from verified subject matter experts