

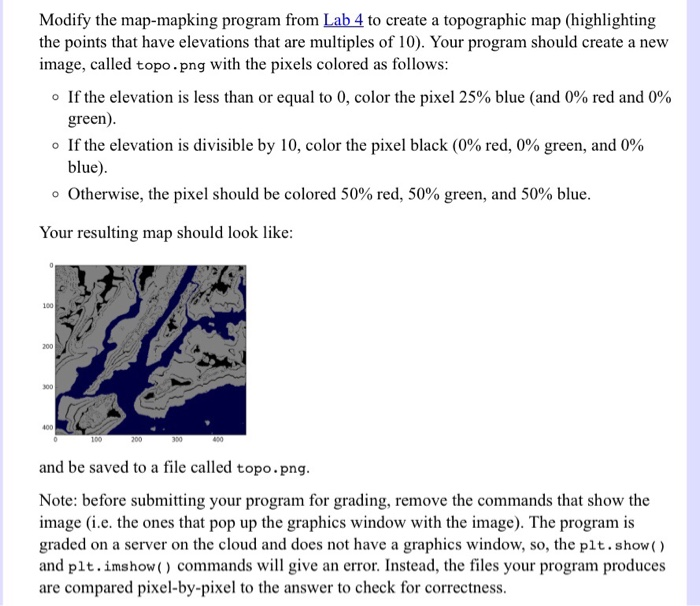
Question: Please modify the Python code in the first photo to satisfy the second photo. Thank you!! # Name: your name here # Date : September
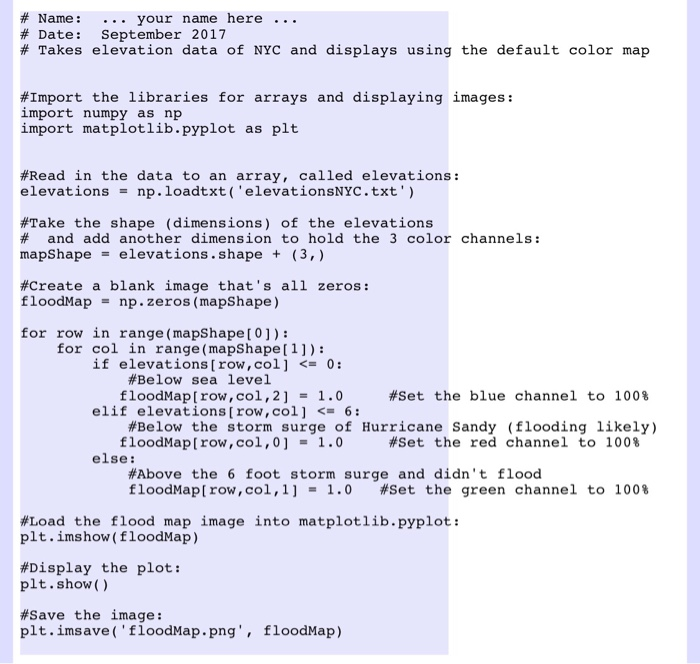
# Name: your name here # Date : September 2017 # Takes elevation data of NYC and displays using the default color map #Import the libraries for arrays and displaying images: import numpy as np import matplotlib.pyplot as plt #Read in the data to an array, called elevations: elevationsnp.loadtxt ('elevationsNYC.txt') #Take the shape (dimensions) of the elevations # and add another dimension to hold the 3 color channels: mapShapeelevations.shape t (3,) #create a blank image that's all zeros: floodMap np.zeros (mapShape) for row in range (mapShape[ 0]): for col in range (mapShape[1]): if elevations [row , col] = 0: #Below sea level floodMap[row, col, 21.0 #set the blue channel to 100% elif elevations [row , col]
Step by Step Solution
There are 3 Steps involved in it

Get step-by-step solutions from verified subject matter experts