

Question: please need help with this Table BL.1: Volumes Needed for Standard CuSO4 Solutions Report Table BL. 1: Absorbance Data Report Table BL.2: Absorbance and Concentration
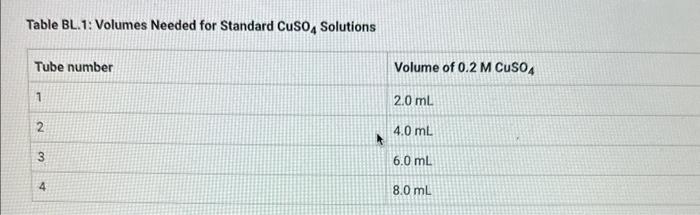
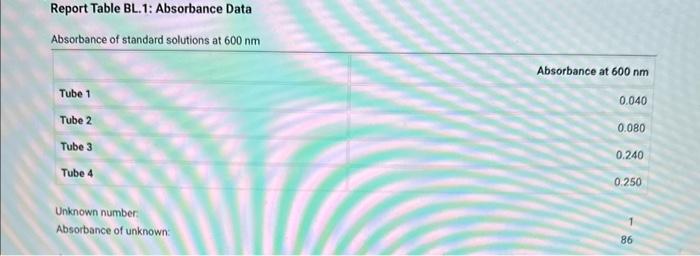
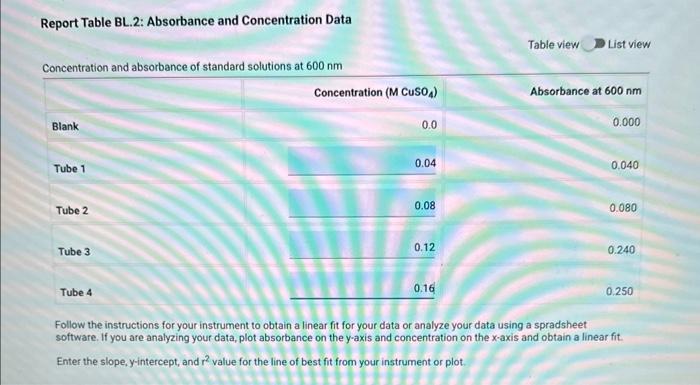
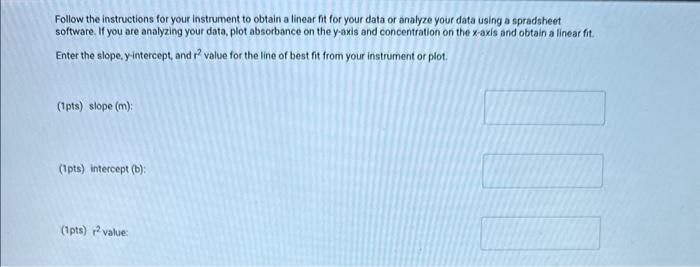
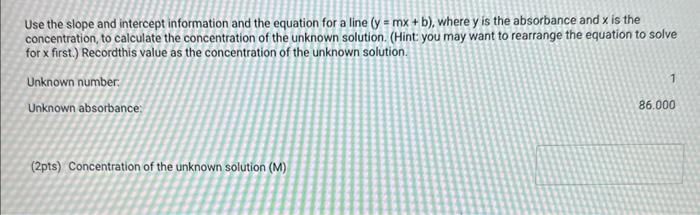
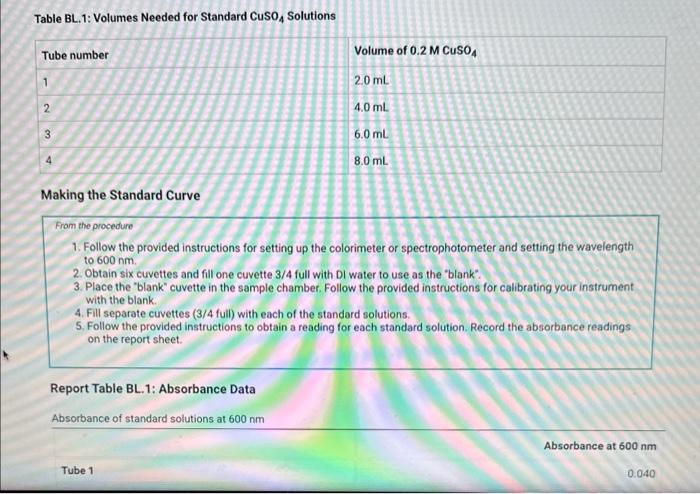
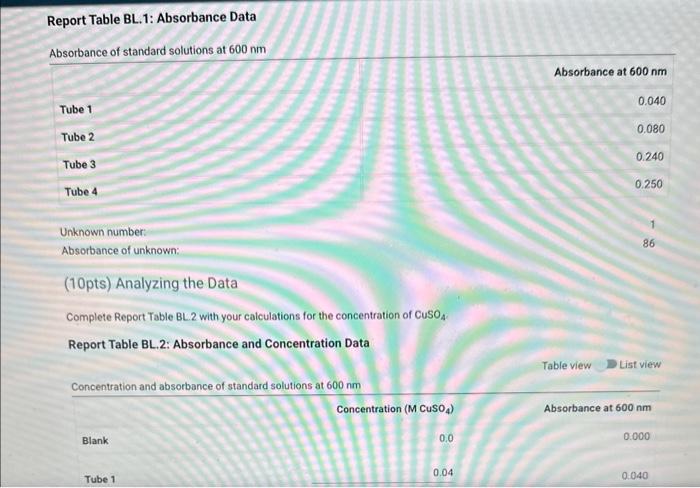
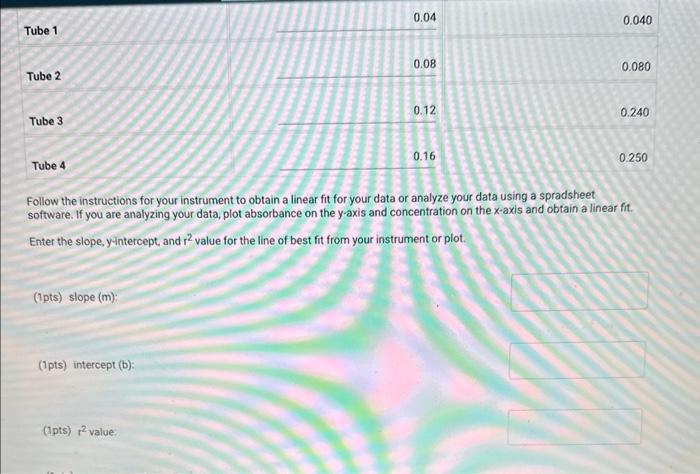
Table BL.1: Volumes Needed for Standard CuSO4 Solutions Report Table BL. 1: Absorbance Data Report Table BL.2: Absorbance and Concentration Data Table view List view Concentration and absorbance of standard solutions at 600nm Follow the instructions for your instrument to obtain a linear fit for your data or analyze your data using a spradsheet software. If you are analyzing your data, plot absorbance on the y-axis and concentration on the x-axis and obtain a linear fit. Enter the slope, y-intercept, and r2 value for the line of best fit from your instrument or plot. Follow the instructions for your instrument to obtain a linear fit for your data or analyze your data using a spradsheet software. If you are analyzing your data, plot absorbance on the y-axis and concentration on the x-axis and obtain a linear fit. Enter the slope, yintercept, and r2 value for the line of best fit from your instrument or piot. (1pts) slope (m); (1pts) intercept (b): (1pts) r2 value: Use the slope and intercept information and the equation for a line (y=mx+b), where y is the absorbance and x is the concentration, to calculate the concentration of the unknown solution. (Hint: you may want to rearrange the equation to solve for x first.) Recordthis value as the concentration of the unknown solution. Unknown number. Unknown absorbance: 86.000 (2pts) Concentration of the unknown solution ( M) Table BL. 1: Volumes Needed for Standard CuSO4 Solutions Making the Standard Curve Fram the procedure 1. Follow the provided instructions for setting up the colorimeter or spectrophotometer and setting the wavelength to 600nm. 2. Obtain six cuvettes and fill one cuvette 3/4 full with DI water to use as the "blank". 3. Place the "blank" cuvette in the sample chamber. Follow the provided instructions for calibrating your instrument with the blank. 4. Fill separate cuvettes ( 3/4 fuil) with each of the standard solutions. 5. Follow the provided instructions to obtain a reading for each standard solution. Record the absorbance readings on the report sheet. P-ow Fakla Di 1. Ahenrhane Data Follow the instructions for your instrument to obtain a linear fit for your data or analyze your data using a spradsheet software. If you are analyzing your data, plot absorbance on the y-axis and concentration on the x-axis and obtain a linear fit. Enter the slope, y-intercept, and r2 value for the line of best fit from your instrument or plot. (7pts) slope (m) : (1 pts) intercept (b): (1pts) r2 value: Use the slope and intercept information and the equation for a line (y=mx+b), where y is the absorbance and x is the concentration, to calculate the concentration of the unknown solution. (Hint: you may want to rearrange the equation to solve for x first.) Recordthis value as the concentration of the unknown solution. Unknown number: Unknown absorbance: 86.000 (2pts) Concentration of the unknown solution (M)
Step by Step Solution
There are 3 Steps involved in it

Get step-by-step solutions from verified subject matter experts