

Question: Please note the Tabs at the bottom for the other questions begin{tabular}{|l|r|r|r|r|} hline TickerSymbol & Shares & Pricepershare2022 & Pricepershare2023 & Current Value hline
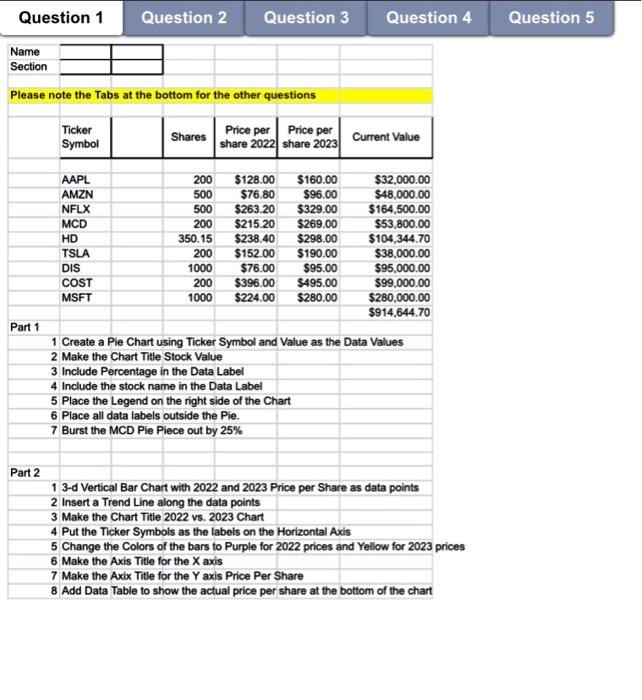
Please note the Tabs at the bottom for the other questions \begin{tabular}{|l|r|r|r|r|} \hline TickerSymbol & Shares & Pricepershare2022 & Pricepershare2023 & Current Value \\ \hline AAPL & & & & \\ \hline AMZN & 200 & $128.00 & $160.00 & $32,000.00 \\ \hline NFLX & 500 & $76.80 & $96.00 & $48,000.00 \\ \hline MCD & 500 & $263.20 & $329.00 & $164,500.00 \\ \hline HD & 200 & $215.20 & $269.00 & $53,800.00 \\ \hline TSLA & 350.15 & $238.40 & $298.00 & $104,344.70 \\ \hline DIS & 200 & $152.00 & $190.00 & $38,000.00 \\ \hline COST & 1000 & $76.00 & $95.00 & $95,000.00 \\ \hline MSFT & 200 & $396.00 & $495.00 & $99,000.00 \\ \hline & 1000 & $224.00 & $280.00 & $280,000.00 \\ \hline & & & & $914,644.70 \\ \hline \end{tabular} Part 1 1 Create a Pie Chart using Ticker Symbol and Value as the Data Values 2 Make the Chart Title Stock Value 3 Include Percentage in the Data Label 4 Include the stock name in the Data Label 5 Place the Legend on the right side of the Chart 6 Place all data labels outside the Pie. 7 Burst the MCD Pie Piece out by 25\% Part 2 1 3-d Vertical Bar Chart with 2022 and 2023 Price per Share as data points 2 Insert a Trend Line along the data points 3 Make the Chart Title 2022 vs. 2023 Chart 4 Put the Ticker Symbols as the labels on the Horizontal Axis 5 Change the Colors of the bars to Purple for 2022 prices and Yellow for 2023 prices 6 Make the Axis Title for the X axis 7 Make the Axix Title for the Y axis Price Per Share 8 Add Data Table to show the actual price per share at the bottom of the chart Please note the Tabs at the bottom for the other questions \begin{tabular}{|l|r|r|r|r|} \hline TickerSymbol & Shares & Pricepershare2022 & Pricepershare2023 & Current Value \\ \hline AAPL & & & & \\ \hline AMZN & 200 & $128.00 & $160.00 & $32,000.00 \\ \hline NFLX & 500 & $76.80 & $96.00 & $48,000.00 \\ \hline MCD & 500 & $263.20 & $329.00 & $164,500.00 \\ \hline HD & 200 & $215.20 & $269.00 & $53,800.00 \\ \hline TSLA & 350.15 & $238.40 & $298.00 & $104,344.70 \\ \hline DIS & 200 & $152.00 & $190.00 & $38,000.00 \\ \hline COST & 1000 & $76.00 & $95.00 & $95,000.00 \\ \hline MSFT & 200 & $396.00 & $495.00 & $99,000.00 \\ \hline & 1000 & $224.00 & $280.00 & $280,000.00 \\ \hline & & & & $914,644.70 \\ \hline \end{tabular} Part 1 1 Create a Pie Chart using Ticker Symbol and Value as the Data Values 2 Make the Chart Title Stock Value 3 Include Percentage in the Data Label 4 Include the stock name in the Data Label 5 Place the Legend on the right side of the Chart 6 Place all data labels outside the Pie. 7 Burst the MCD Pie Piece out by 25\% Part 2 1 3-d Vertical Bar Chart with 2022 and 2023 Price per Share as data points 2 Insert a Trend Line along the data points 3 Make the Chart Title 2022 vs. 2023 Chart 4 Put the Ticker Symbols as the labels on the Horizontal Axis 5 Change the Colors of the bars to Purple for 2022 prices and Yellow for 2023 prices 6 Make the Axis Title for the X axis 7 Make the Axix Title for the Y axis Price Per Share 8 Add Data Table to show the actual price per share at the bottom of the chart
Step by Step Solution
There are 3 Steps involved in it

Get step-by-step solutions from verified subject matter experts