

Question: Please only a solution to the second question please((Q2)) confirm that the code works in MATLAB in order to copy the code you will write
Please only a solution to the second question please((Q2)) confirm that the code works in MATLAB in order to copy the code you will write and try it in my device
Q2. Plot the impulse response of a Butterworth LPF of cutoff frequency 2 kHz, and order 5.
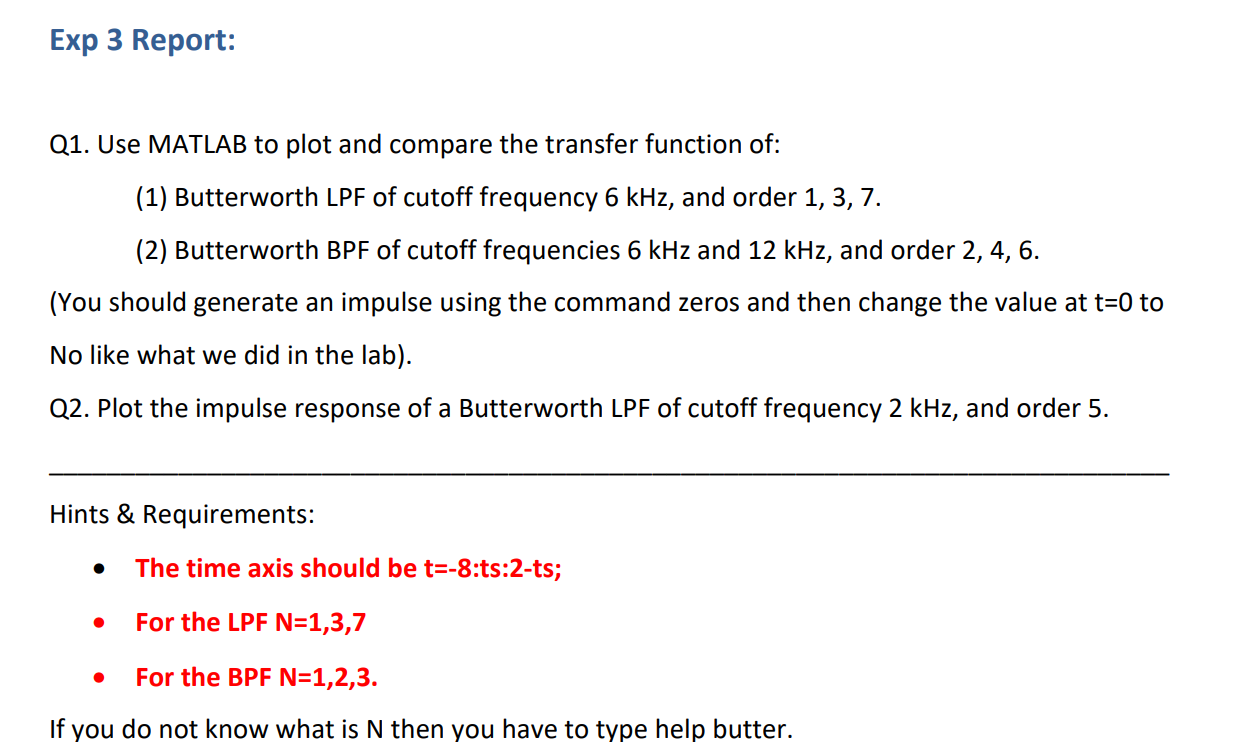
Q1. Use MATLAB to plot and compare the transfer function of: (1) Butterworth LPF of cutoff frequency 6kHz, and order 1, 3, 7. (2) Butterworth BPF of cutoff frequencies 6kHz and 12kHz, and order 2, 4, 6. (You should generate an impulse using the command zeros and then change the value at t=0 to No like what we did in the lab). Q2. Plot the impulse response of a Butterworth LPF of cutoff frequency 2kHz, and order 5. Hints \& Requirements: - The time axis should be t=-8:ts:2-ts; - For the LPF N=1,3,7 - For the BPF N=1,2,3. If you do not know what is N then you have to type help butter
Step by Step Solution
There are 3 Steps involved in it

Get step-by-step solutions from verified subject matter experts