

Question: Please only answer question e , e2 *** QUESTIONS **** E. Effect of pH on Catalase Activity Complete the table below describing what you added
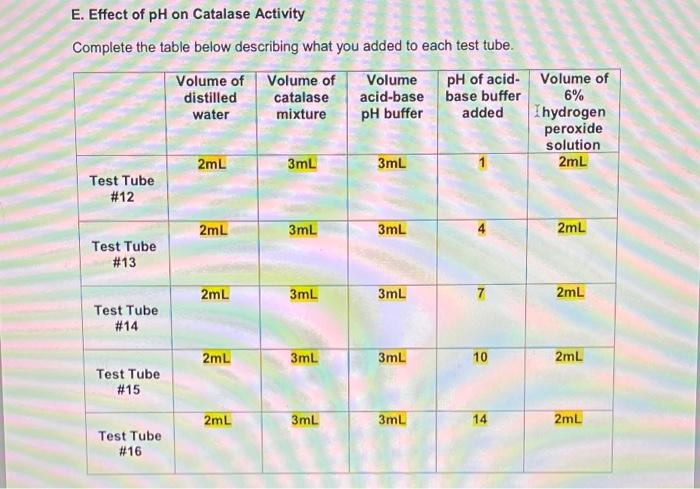
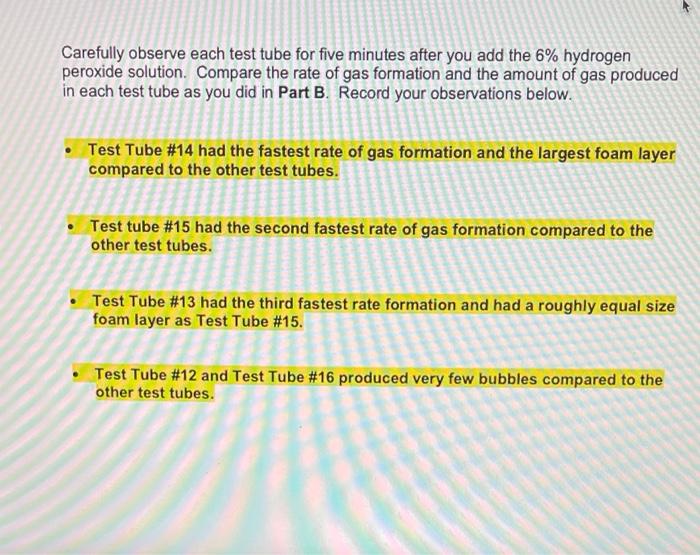
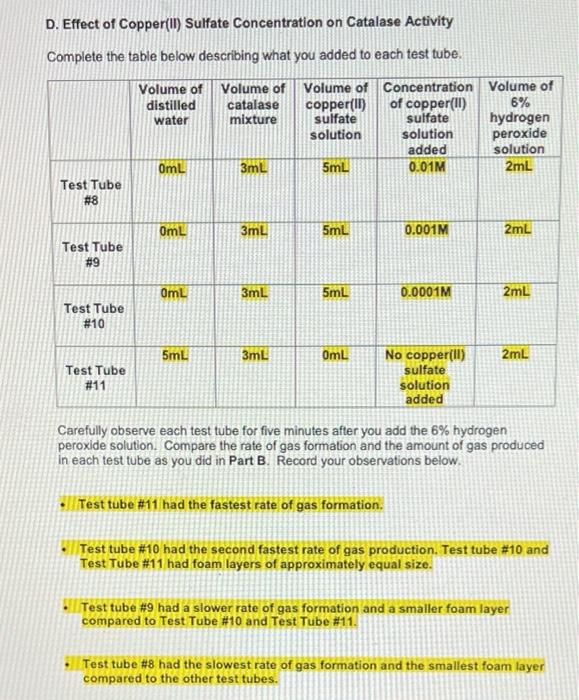
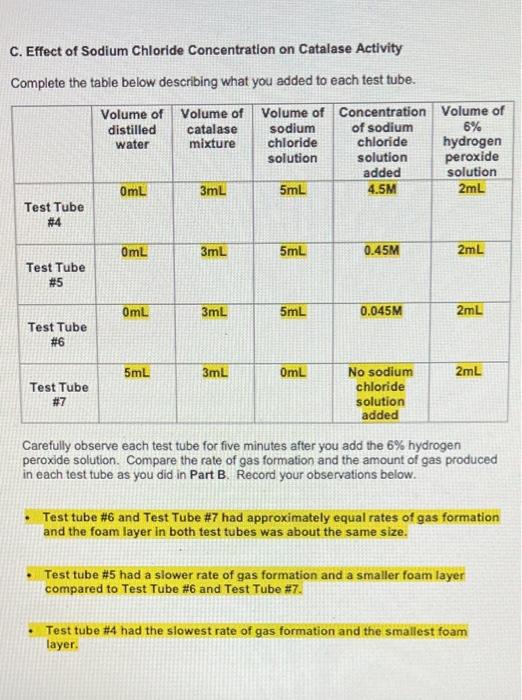
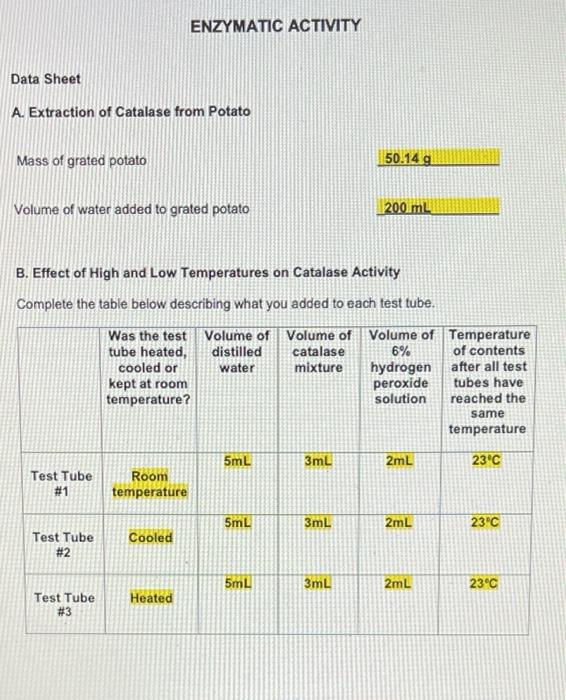
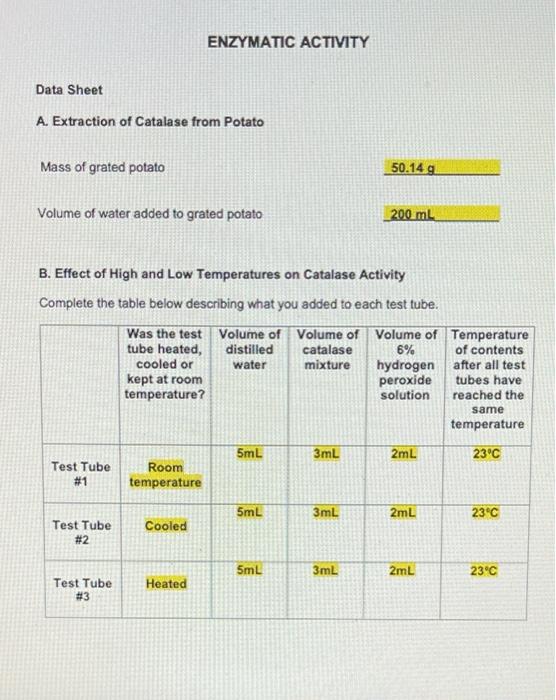
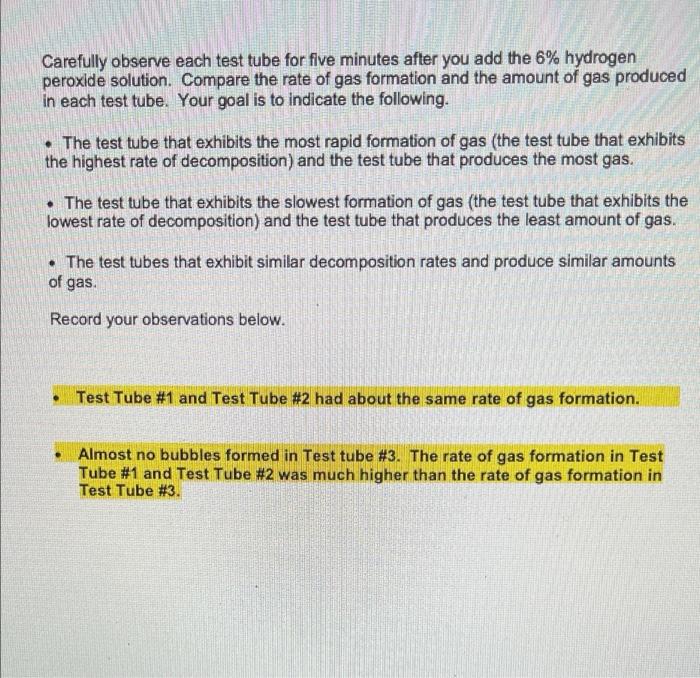
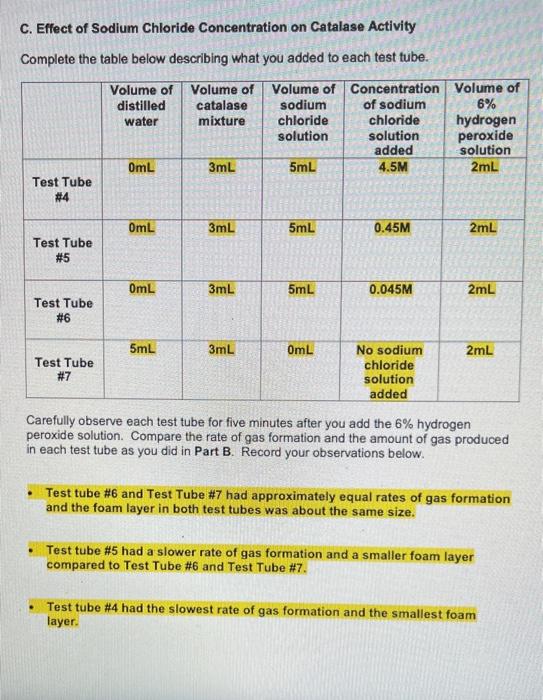

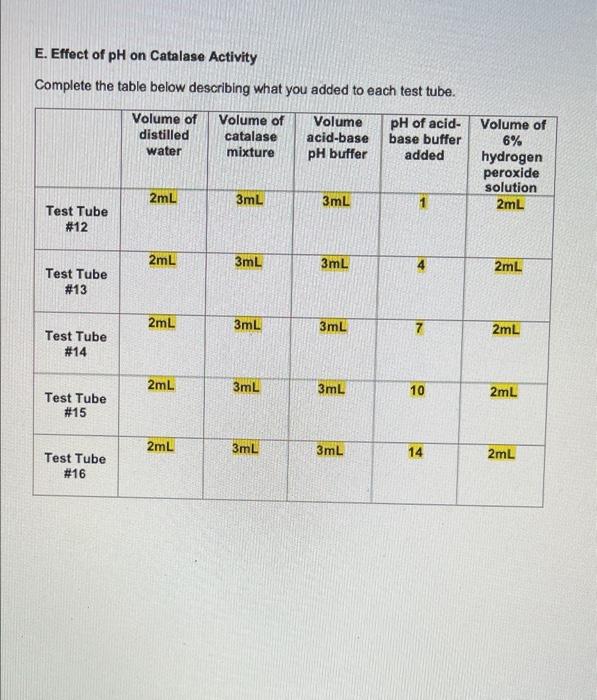
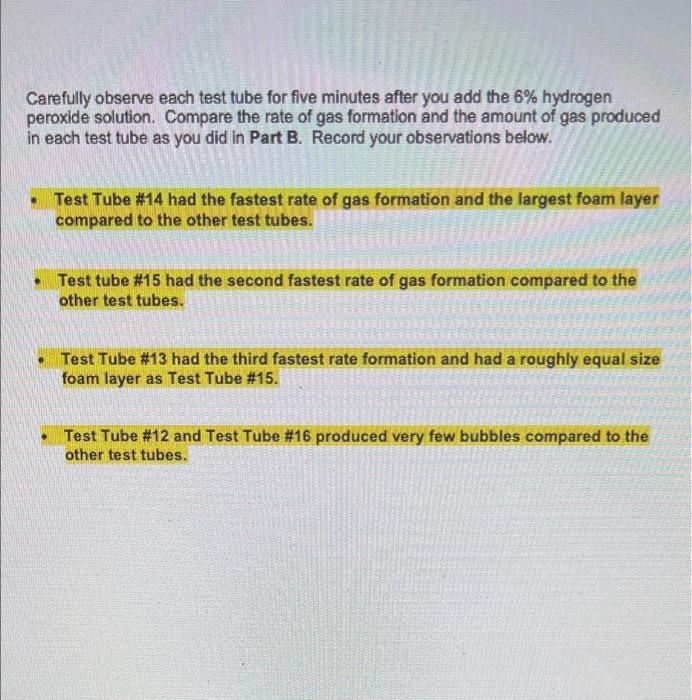
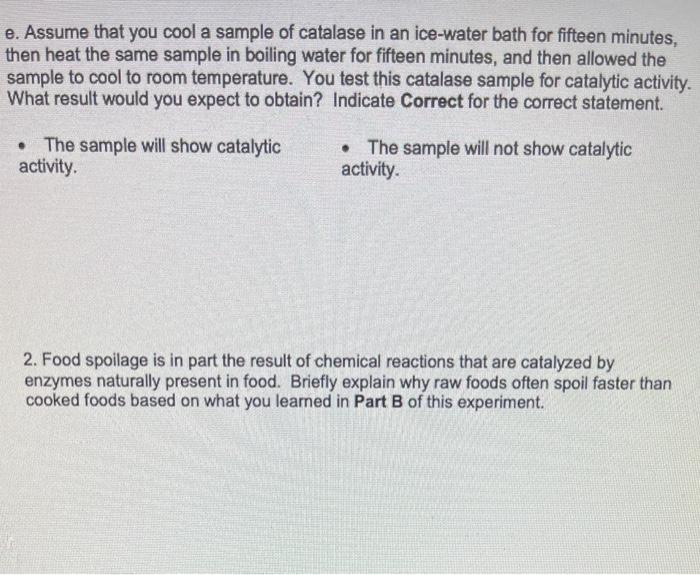
E. Effect of pH on Catalase Activity Complete the table below describing what you added to each test tube. Volume of Volume of distilled Volume acid-base pH of acid- base buffer catalase water mixture pH buffer added 2mL 3mL 3mL Test Tube # 12 2mL 3mL 3mL Test Tube # 13 2mL 3mL 3mL Test Tube # 14 2mL 3mL 3mL Test Tube # 15 2mL 3mL 3mL Test Tube # 16 7 10 14 Volume of 6% Ihydrogen peroxide solution 2mL 2mL 2mL 2mL 2mL Carefully observe each test tube for five minutes after you add the 6% hydrogen peroxide solution. Compare the rate of gas formation and the amount of gas produced in each test tube as you did in Part B. Record your observations below. Test Tube #14 had the fastest rate of gas formation and the largest foam layer compared to the other test tubes. Test tube #15 had the second fastest rate of gas formation compared to the other test tubes. Test Tube #13 had the third fastest rate formation and had a roughly equal size foam layer as Test Tube #15. Test Tube #12 and Test Tube #16 produced very few bubbles compared to the other test tubes. D. Effect of Copper(II) Sulfate Concentration on Catalase Activity Complete the table below describing what you added to each test tube. Volume of Volume of Volume of distilled catalase Volume of Concentration of copper(II) sulfate copper(II) sulfate 6% hydrogen water mixture solution solution peroxide added solution OmL 3mL 5mL 0.01M 2mL Test Tube #8 OmL 3mL 5mL 0.001M 2mL Test Tube # 9 OmL 3mL 5mL 0.0001M 2mL Test Tube # 10 5mL 3mL OmL 2mL No copper(ll) sulfate Test Tube # 11 solution added Carefully observe each test tube for five minutes after you add the 6% hydrogen peroxide solution. Compare the rate of gas formation and the amount of gas produced in each test tube as you did in Part B. Record your observations below. Test tube #11 had the fastest rate of gas formation. Test tube # 10 had the second fastest rate of gas production. Test tube # 10 and Test Tube # 11 had foam layers of approximately equal size. Test tube # 9 had a slower rate of gas formation and a smaller foam layer compared to Test Tube # 10 and Test Tube # 11. Test tube #8 had the slowest rate of gas formation and the smallest foam layer compared to the other test tubes. C. Effect of Sodium Chloride Concentration on Catalase Activity Complete the table below describing what you added to each test tube. Volume of Volume of Volume of Concentration Volume of distilled catalase sodium of sodium 6% hydrogen water mixture chloride chloride solution solution peroxide added solution 0mL 3mL 5mL 4.5M 2mL Test Tube #4 0mL 3mL 5mL 0.45M 2mL Test Tube # 5 0mL 3mL 5mL 0.045M 2mL Test Tube #6 5mL 3mL OmL 2mL No sodium chloride Test Tube #7 solution added Carefully observe each test tube for five minutes after you add the 6% hydrogen peroxide solution. Compare the rate of gas formation and the amount of gas produced in each test tube as you did in Part B. Record your observations below. Test tube #6 and Test Tube # 7 had approximately equal rates of gas formation and the foam layer in both test tubes was about the same size. Test tube # 5 had a slower rate of gas formation and a smaller foam layer compared to Test Tube # 6 and Test Tube # 7. Test tube #4 had the slowest rate of gas formation and the smallest foam layer. ENZYMATIC ACTIVITY Data Sheet A. Extraction of Catalase from Potato Mass of grated potato 50.14 g Volume of water added to grated potato 200 mL B. Effect of High and Low Temperatures on Catalase Activity Complete the table below describing what you added to each test tube. Volume of Volume of Was the test Volume of tube heated, cooled or distilled catalase 6% water mixture hydrogen kept at room peroxide temperature? solution 5mL 3mL 2mL Room temperature 5mL 3mL 2mL Cooled 5mL 3mL 2mL Heated Test Tube # 1 Test Tube # 2 Test Tube # 3 Temperature of contents after all test tubes have reached the same temperature 23C 23C 23C ENZYMATIC ACTIVITY Data Sheet A. Extraction of Catalase from Potato Mass of grated potato 50.14 g Volume of water added to grated potato 200 mL B. Effect of High and Low Temperatures on Catalase Activity Complete the table below describing what you added to each test tube. Volume of Volume of distilled catalase 6% Was the test Volume of tube heated, cooled or kept at room water mixture hydrogen peroxide solution temperature? 5mL 3mL 2mL Test Tube # 1 Room temperature 5mL 3mL 2mL Cooled Test Tube #2 5mL 3mL 2mL Test Tube Heated # 3 Temperature of contents after all test tubes have reached the same temperature 23C 23C 23C Carefully observe each test tube for five minutes after you add the 6% hydrogen peroxide solution. Compare the rate of gas formation and the amount of gas produced in each test tube. Your goal is to indicate the following. The test tube that exhibits the most rapid formation of gas (the test tube that exhibits the highest rate of decomposition) and the test tube that produces the most gas. The test tube that exhibits the slowest formation of gas (the test tube that exhibits the lowest rate of decomposition) and the test tube that produces the least amount of gas. The test tubes that exhibit similar decomposition rates and produce similar amounts of gas Record your observations below. Test Tube #1 and Test Tube #2 had about the same rate of gas formation. Almost no bubbles formed in Test tube #3. The rate of gas formation in Test Tube #1 and Test Tube #2 was much higher than the rate of gas formation in Test Tube #3. C. Effect of Sodium Chloride Concentration on Catalase Activity Complete the table below describing what you added to each test tube. Volume of Volume of Volume of Concentration Volume of distilled catalase sodium of sodium 6% hydrogen water mixture chloride chloride solution solution peroxide added solution OmL 3mL 5mL 4.5M 2mL Test Tube #4 OmL 3mL 5mL 0.45M 2mL Test Tube #5 OmL 3mL 5mL 0.045M 2mL Test Tube #6 5mL 3mL OmL 2mL No sodium chloride Test Tube #7 solution added Carefully observe each test tube for five minutes after you add the 6% hydrogen peroxide solution. Compare the rate of gas formation and the amount of gas produced in each test tube as you did in Part B. Record your observations below. Test tube # 6 and Test Tube #7 had approximately equal rates of gas formation and the foam layer in both test tubes was about the same size. . Test tube # 5 had a slower rate of gas formation and a smaller foam layer compared to Test Tube #6 and Test Tube #7. . Test tube # 4 had the slowest rate of gas formation and the smallest foam layer. D. Effect of Copper(1) Sulfate Concentration on Catalase Activity Complete the table below describing what you added to each test tube. Volume of distilled water Volume of Volume of Concentration Volume of catalase copper(11) of copper(1) 6% mixture sulfate sulfate hydrogen solution solution peroxide added solution 3mL 5mL 0.01M 2mL OmL Test Tube #8 OmL 3mL 5mL 0.001M 2mL Test Tube #9 OmL 3mL 5mL 0.0001M 2mL Test Tube #10 5mL 3mL OmL 2mL Test Tube #11 No copper(II) sulfate solution added Carefully observe each test tube for five minutes after you add the 6% hydrogen peroxide solution. Compare the rate of gas formation and the amount of gas produced in each test tube as you did in Part B. Record your observations below. . Test tube #11 had the fastest rate of gas formation. Test tube #10 had the second fastest rate of gas production. Test tube #10 and Test Tube #11 had foam layers of approximately equal size. Test tube #9 had a slower rate of gas formation and a smaller foam layer compared to Test Tube #10 and Test Tube #11. . Test tube #8 had the slowest rate of gas formation and the smallest foam layer compared to the other test tubes. E. Effect of pH on Catalase Activity Complete the table below describing what you added to each test tube. Volume of Volume of Volume distilled catalase acid-base pH of acid- base buffer added water mixture pH buffer 2mL 3mL 3mL Test Tube # 12 2mL 3mL 3mL Test Tube # 13 2mL 3mL 3mL Test Tube # 14 3mL 3mL Test Tube # 15 3mL 3mL Test Tube # 16 2mL 2mL 7 10 14 Volume of 6% hydrogen peroxide solution 2mL 2mL 2mL 2mL 2mL Carefully observe each test tube for five minutes after you add the 6% hydrogen peroxide solution. Compare the rate of gas formation and the amount of gas produced in each test tube as you did in Part B. Record your observations below. Test Tube # 14 had the fastest rate of gas formation and the largest foam layer compared to the other test tubes. Test tube # 15 had the second fastest rate of gas formation compared to the other test tubes. Test Tube # 13 had the third fastest rate formation and had a roughly equal size foam layer as Test Tube # 15. Test Tube # 12 and Test Tube # 16 produced very few bubbles compared to the other test tubes. e. Assume that you cool a sample of catalase in an ice-water bath for fifteen minutes, then heat the same sample in boiling water for fifteen minutes, and then allowed the sample to cool to room temperature. You test this catalase sample for catalytic activity. What result would you expect to obtain? Indicate Correct for the correct statement. The sample will show catalytic activity. . The sample will not show catalytic activity. 2. Food spoilage is in part the result of chemical reactions that are catalyzed by enzymes naturally present in food. Briefly explain why raw foods often spoil faster than cooked foods based on what you learned in Part B of this experiment
Step by Step Solution
There are 3 Steps involved in it

Get step-by-step solutions from verified subject matter experts