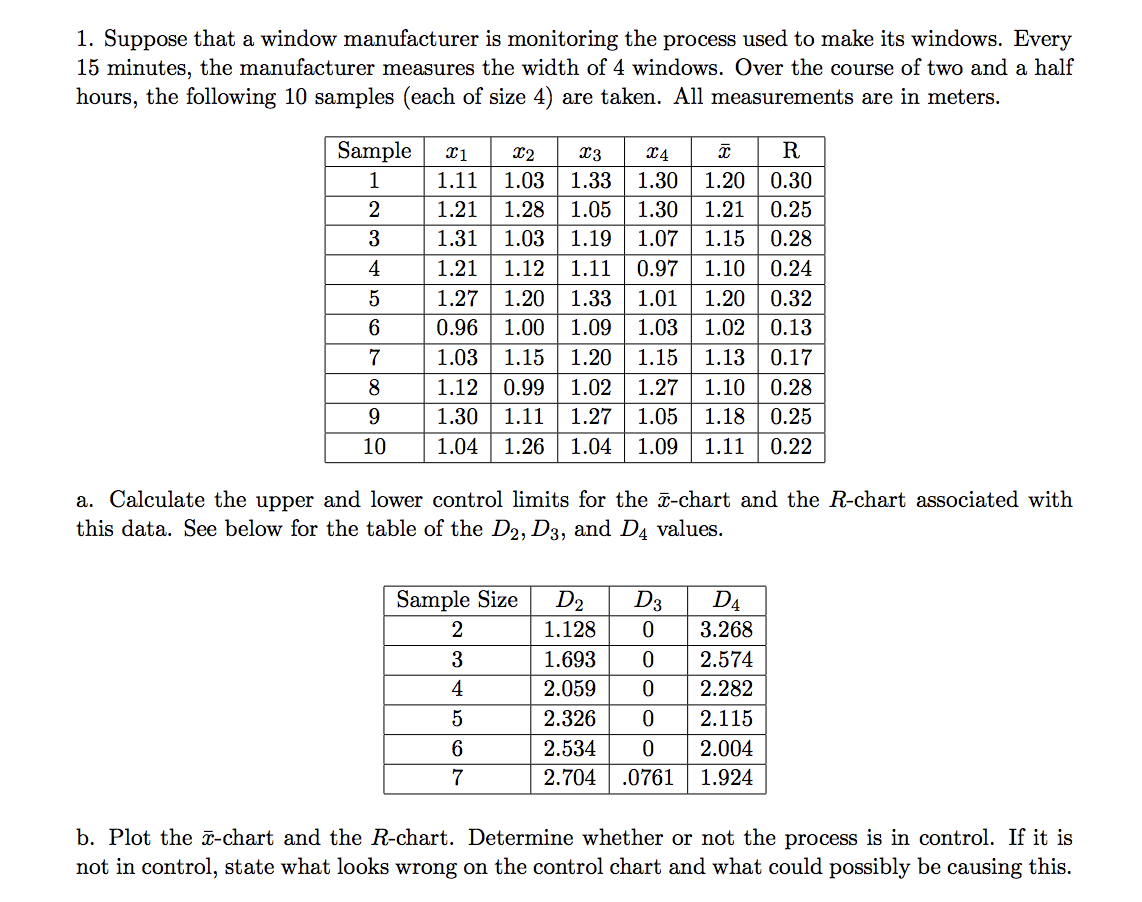
Question: (Please only the b question) 1. Suppose that a window manufacturer is monitoring the process used to make its windows. Every 15 minutes, the manufacturer

(Please only the b question) 1. Suppose that a (Please only the b question)

1. Suppose that a window manufacturer is monitoring the process used to make its windows. Every 15 minutes, the manufacturer measures the width of 4 windows. Over the course of two and a half hours, the following 10 samples (each of size 4) are taken. All measurements are in meters. Sample 1 4 21 22 23 24 R 1.11 1.03 1.33 1.30 1.20 0.30 1.21 1.28 1.05 1.30 1.21 0.25 1.31 | 1.03 1.19 1.07 1.15 0.28 | 1.21 1.12 1.11 0.97 1.10 0.24 | 1.27 1.20 1.33 1.01 | 1.20 0.32 0.96 1.00 1.09 1.03 1.02 0.13 | 1.03 1.15 1.20 1.15 1.13 0.17 1.12 0.99 1.02 1.27 1.10 0.28 1.30 | 1.11 | 1.27 | 1.05 | 1.18 | 0.25 1.04 | 1.26 1.04 | 1.09 | 1.11 0.22 8 9 10 a. Calculate the upper and lower control limits for the -chart and the R-chart associated with this data. See below for the table of the D2, D3, and D4 values. Sample Size 2 3 D2 D3 1.1280 1.693 0 2.059 2.326 0 2.534 0 2.704 .0761 D4 3.268 2.574 2.282 2.115 2.004 1.924 5 6 7 b. Plot the T-chart and the R-chart. Determine whether or not the process is in control. If it is not in control, state what looks wrong on the control chart and what could possibly be causing this

Step by Step Solution

There are 3 Steps involved in it

1 Expert Approved Answer
Step: 1 Unlock blur-text-image
Question Has Been Solved by an Expert!

Get step-by-step solutions from verified subject matter experts

Step: 2 Unlock
Step: 3 Unlock

Students Have Also Explored These Related General Management Questions!