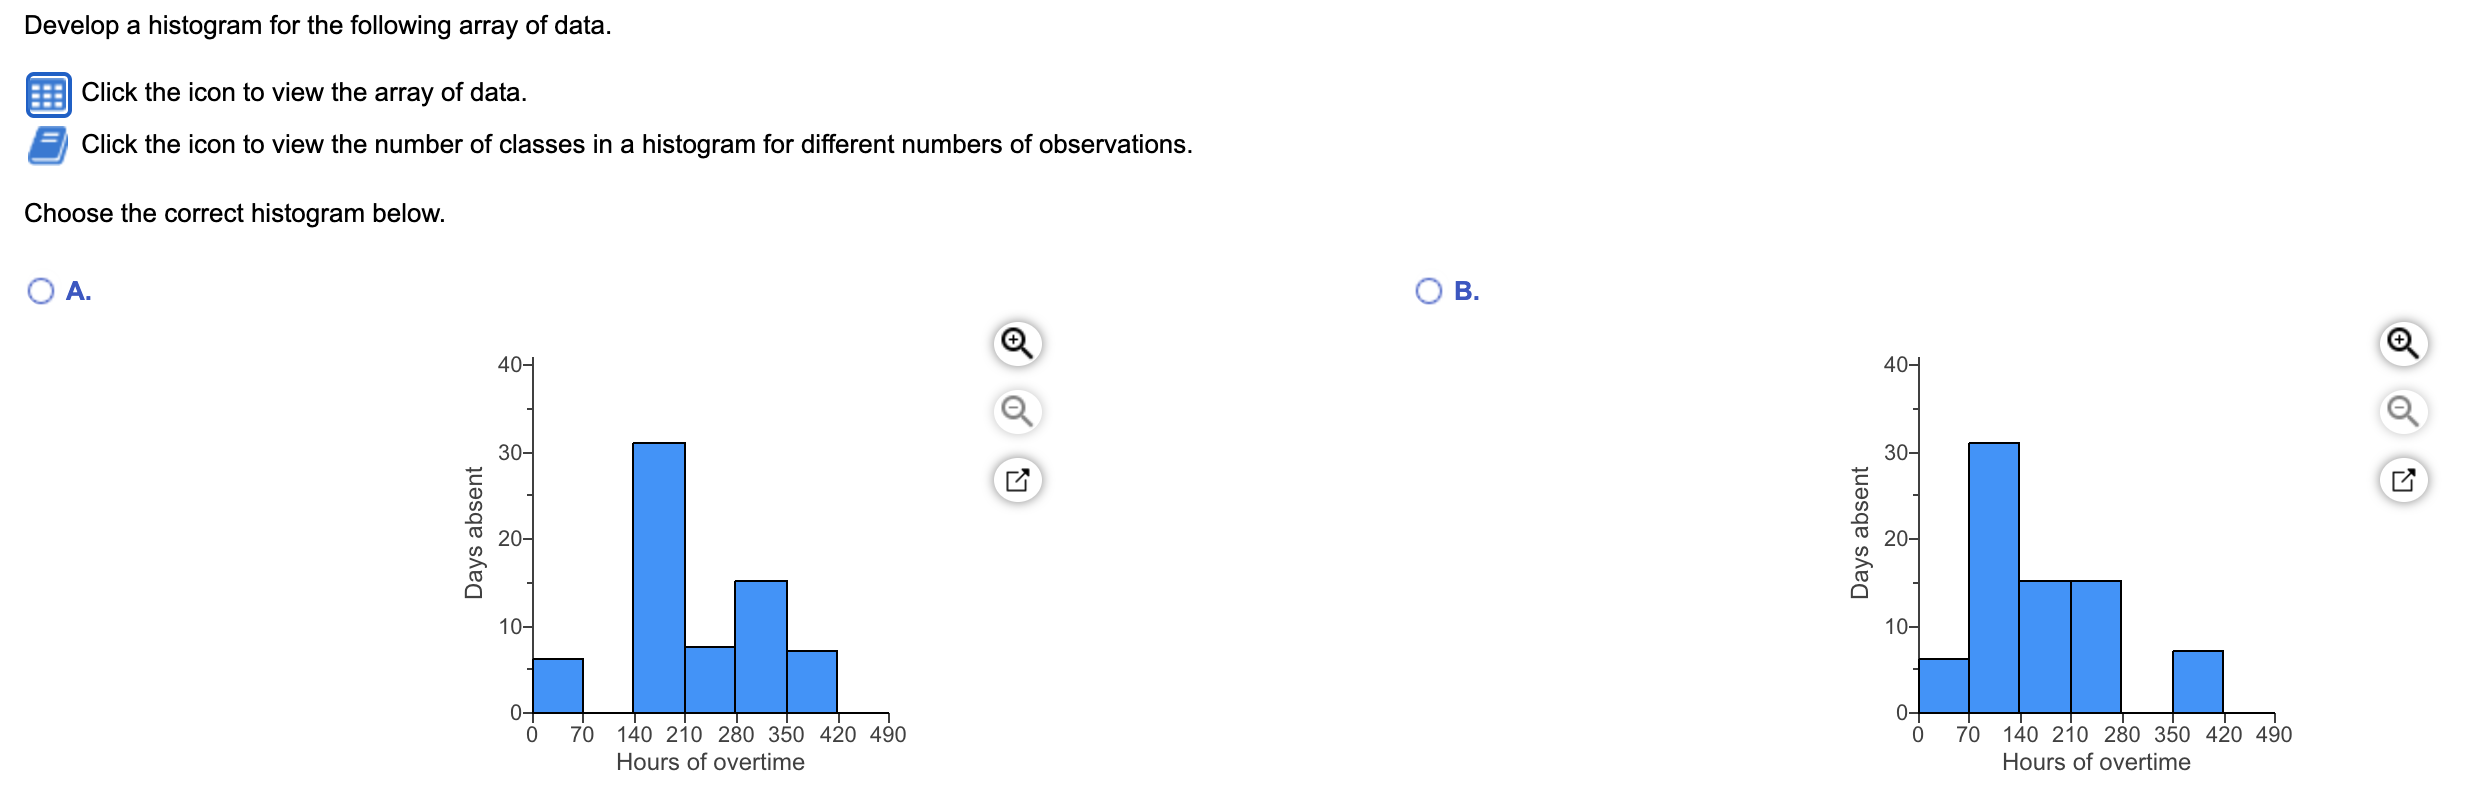
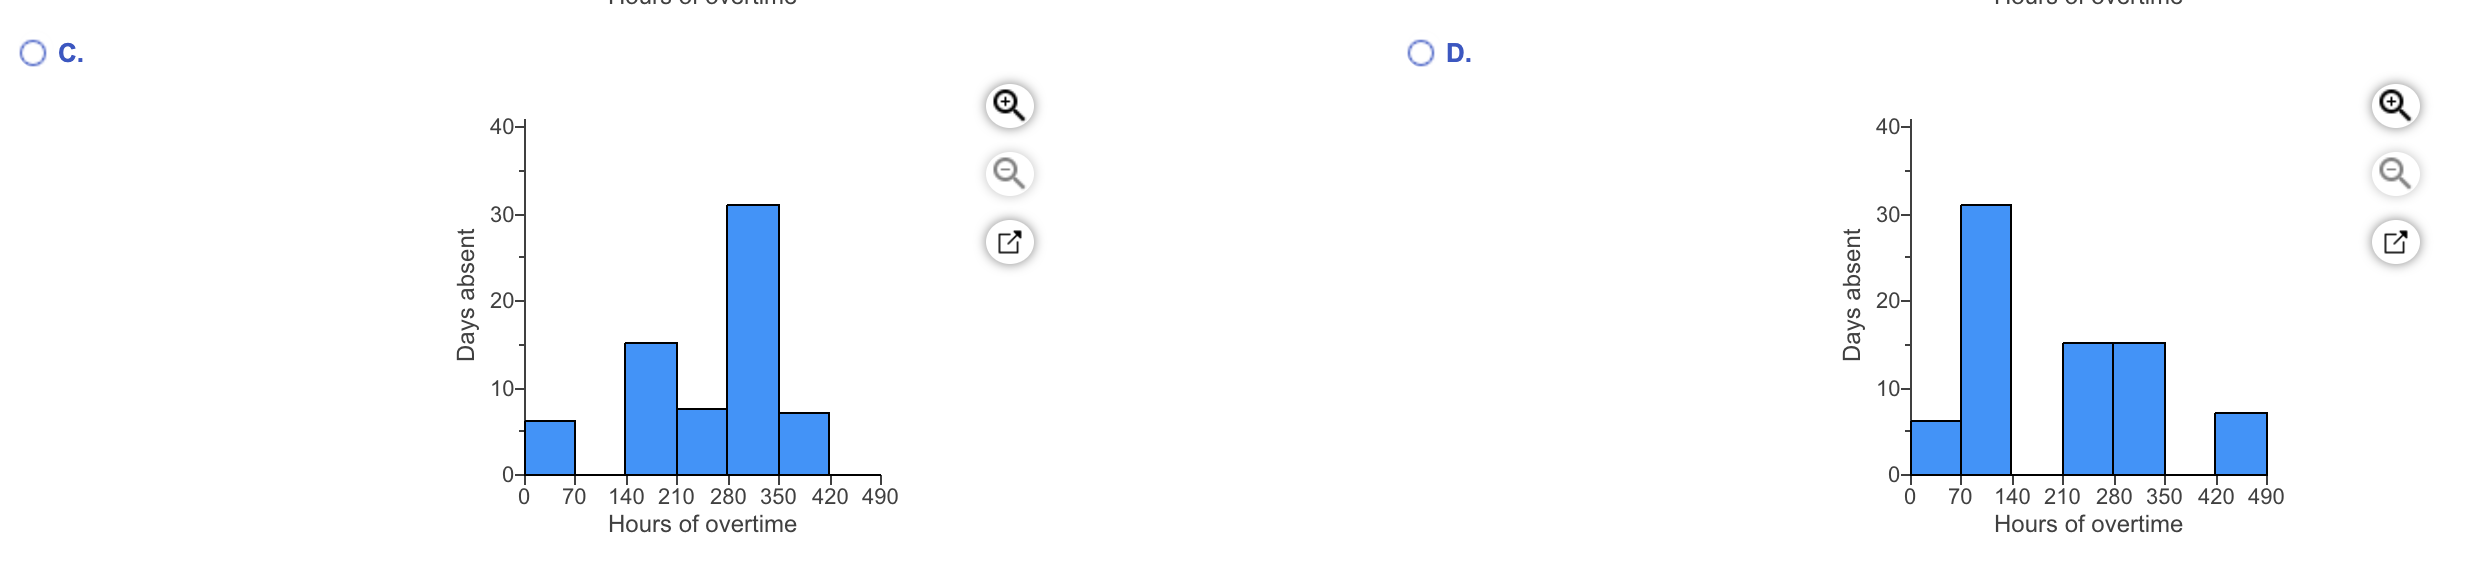
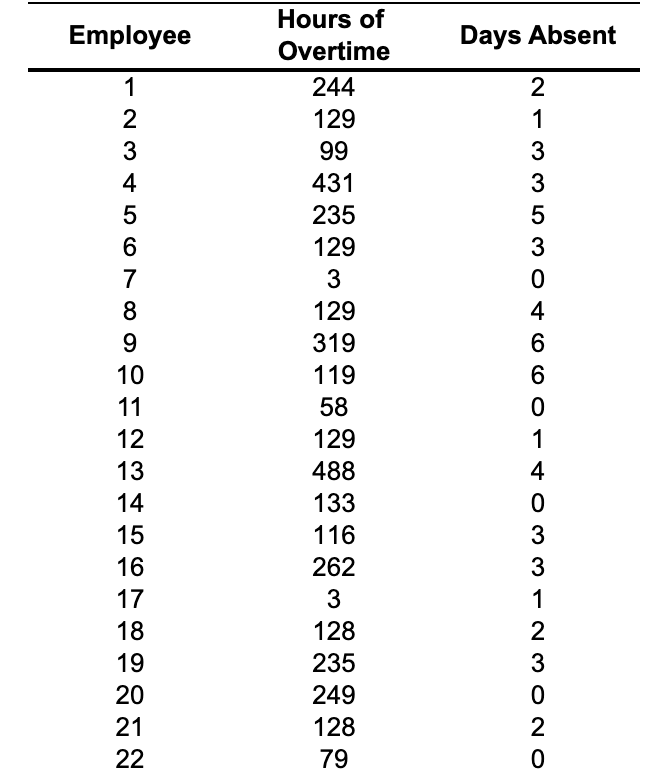
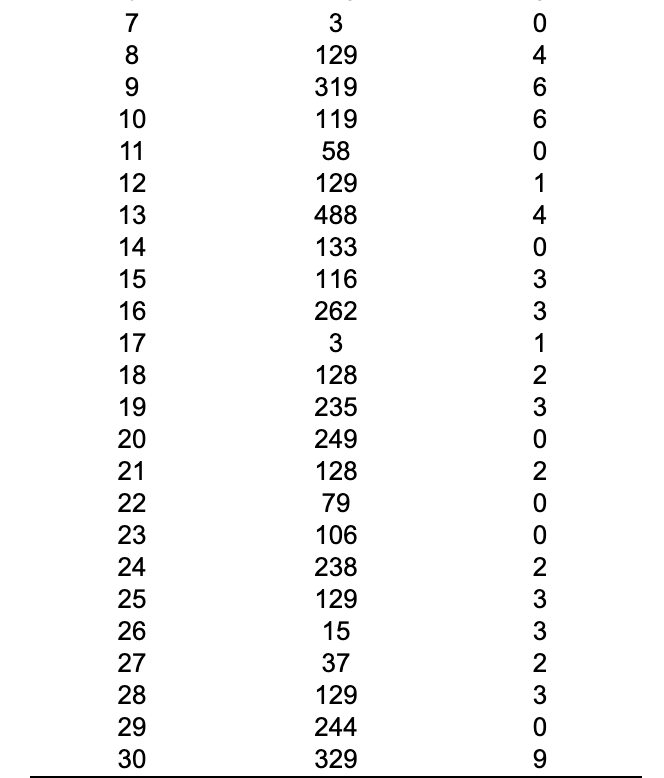
Question: Please pick A, B, C or D Develop a histogram for the following array of data. Click the icon to view the array of data.

Please pick A, B, C or D

Please pick A, B, C or D Develop a histogram for

Please pick A, B, C or D Develop a histogram for

Please pick A, B, C or D Develop a histogram forPlease pick A, B, C or D Develop a histogram for

Please pick A, B, C or D Develop a histogram for

Develop a histogram for the following array of data. Click the icon to view the array of data. Click the icon to view the number of classes in a histogram for different numbers of observations. Choose the correct histogram below. O A. OB. 40- 40- 30- 30- Days absent 20- 20- Days absent L 10- 10- 0- 0 0- 0 70 70 140 210 280 350 420 490 Hours of overtime 140 210 280 350 420 490 Hours of overtime D. o 40 40- Q 30- 30- Days absent 20- 20- . 1 Days absent 10- 10- FO 0- 0 70 70 140 210 280 350 420 490 Hours of overtime 140 210 280 350 420 490 Hours of overtime Employee Days Absent coco voor AWN 1 2 3 4 5 6 7 8 9 10 11 12 13 14 15 16 17 18 19 20 21 22 Hours of Overtime 244 129 99 431 235 129 3 129 319 119 58 129 488 133 116 262 3 128 235 249 128 79 ONO WNW WO O O O AO 1 4 7 8 9 10 11 12 13 14 15 16 17 18 19 20 21 22 23 24 25 26 27 28 29 30 3 129 319 119 58 129 488 133 116 262 3 128 235 249 128 79 106 238 129 15 37 129 244 329 NWWNOONOWN-WWO Number of observation 9 to 16 17 to 32 33 to 64 65 to 128 129 to 256 Number of classes 4 5 6 7 8

Step by Step Solution

There are 3 Steps involved in it

1 Expert Approved Answer
Step: 1 Unlock blur-text-image
Question Has Been Solved by an Expert!

Get step-by-step solutions from verified subject matter experts

Step: 2 Unlock
Step: 3 Unlock

Students Have Also Explored These Related General Management Questions!