

Question: please pick the right answer, thank you. The given graph shows the temperature Tin 'F at a city between 6 A.M. and 6 (a) Estimate
please pick the right answer, thank you.
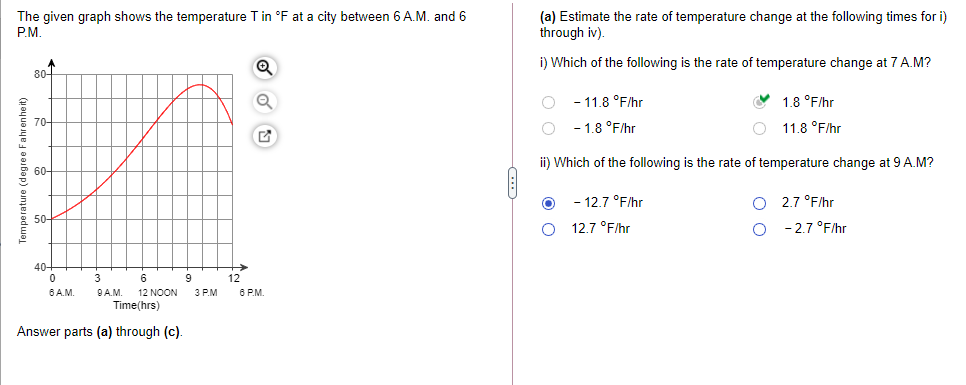
The given graph shows the temperature Tin 'F at a city between 6 A.M. and 6 (a) Estimate the rate of temperature change at the following times for i) P.M. through iv). i) Which of the following is the rate of temperature change at 7 A.M? 80- O - 11.8 F/hr 1.8 F/hr 70- O - 1.8 F/hr O 11.8 F/hr ii) Which of the following is the rate of temperature change at 9 A.M? Temperature (degree Fahrenheit) 60- O - 12.7 F/hr O 2.7 F/hr 50- O 12.7 F/hr -2.7 F/hr 40+ 0 3 6 9 12 6 A.M. 9 A.M. 12 NOON 3 P.M 6 P.M. Time(hrs) Answer parts (a) through (c)
Step by Step Solution
There are 3 Steps involved in it
1 Expert Approved Answer
Step: 1 Unlock

Question Has Been Solved by an Expert!
Get step-by-step solutions from verified subject matter experts
Step: 2 Unlock
Step: 3 Unlock