

Question: please please help me i cant figure it out A cell phone manufacturer inspects the video display on each color phone to verify that the
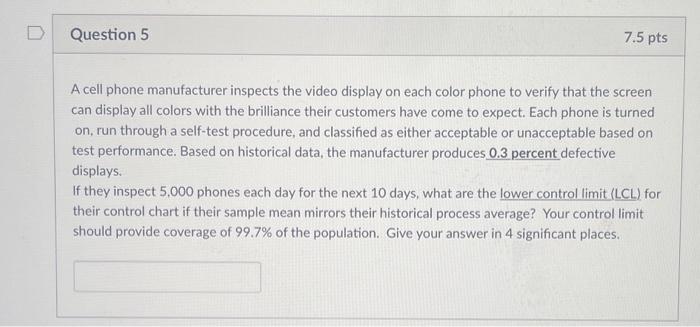
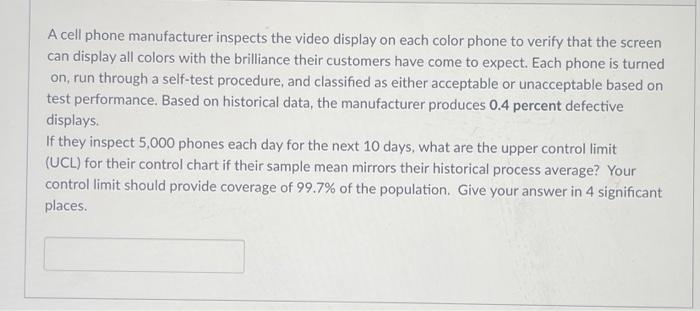
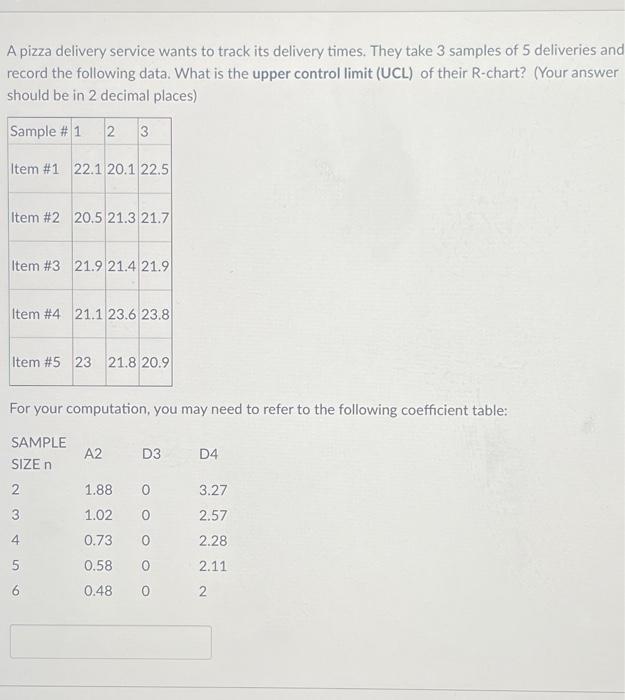
A cell phone manufacturer inspects the video display on each color phone to verify that the screen can display all colors with the brilliance their customers have come to expect. Each phone is turned on, run through a self-test procedure, and classified as either acceptable or unacceptable based on test performance. Based on historical data, the manufacturer produces 0.3 percent defective displays. If they inspect 5,000 phones each day for the next 10 days, what are the lower control limit (LCL) for their control chart if their sample mean mirrors their historical process average? Your control limit should provide coverage of 99.7% of the population. Give your answer in 4 significant places. A cell phone manufacturer inspects the video display on each color phone to verify that the screen can display all colors with the brilliance their customers have come to expect. Each phone is turned on, run through a self-test procedure, and classified as either acceptable or unacceptable based on test performance. Based on historical data, the manufacturer produces 0.4 percent defective displays. If they inspect 5,000 phones each day for the next 10 days, what are the upper control limit (UCL) for their control chart if their sample mean mirrors their historical process average? Your control limit should provide coverage of 99.7% of the population. Give your answer in 4 significant places. A pizza delivery service wants to track its delivery times. They take 3 samples of 5 deliveries an record the following data. What is the upper control limit (UCL) of their R-chart? (Your answer should be in 2 decimal places) For your computation, you may need to refer to the following coefficient table
Step by Step Solution
There are 3 Steps involved in it

Get step-by-step solutions from verified subject matter experts