

Question: Please please please answer quickly Case study:- Balance sheet of Sage Inc. Summary of common-size (vertical ratios) of balance sheet of Sage Inc. for the
Please please please answer quickly
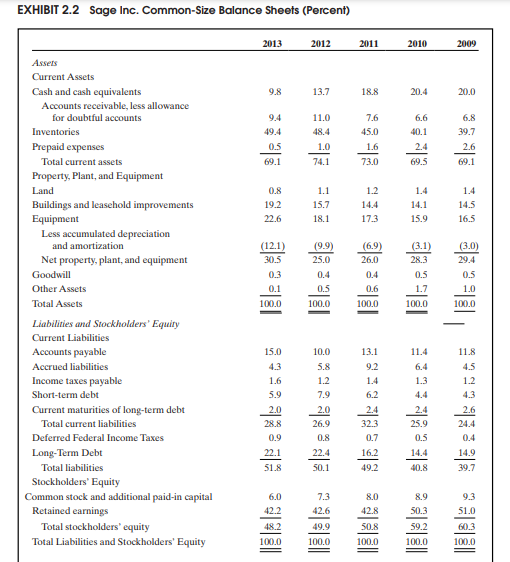
Case study:- Balance sheet of Sage Inc.
Summary of common-size (vertical ratios) of balance sheet of Sage Inc. for the years.
-----------------------------------------------------------------------------------------------------------
Assets-
Current assets: 2013: $65846 {69.1%} 2012: $56264 {74.1%}
Non-current assets: 2013: $29452 {30.9%} 2012: $19645 {25.9%}
Total assets: 2013: $95298 {100%} 2012: $75909 {100%}
-------------------------------------------------------------------------------------------------------
Liabilities-
Current liabilities: 2013: $27461 {28.8%} 2012: $20432 {26.9%}
Long-term liabilities: 2013: $21902 {23%} 2012: $17610 {23.2%}
Total liabilities: 2013: $49363 {51.8%} 2012: $38042 {50.1%}
---------------------------------------------------------------------------------------------------------
Equity-
Capital: 2013: $5760 {6%} 2012: $5504 {7.3%}
R/E: 2013: $40175 {42.2%} 2012: $32363 {42.6%}
Total equity: 2013: $45935 {48.2%} 2012: $37867 {49.9%}
TL&E: 2013: $95298 {100%} 2012: $75909 {100%}
Write an analytical report for evaluating the following financial policies and positions for Sage Inc. for the years 2013 and 2012 by applying Vertical Analysis Tool (VAT):
- Evaluating the external financing sources structure policy/ Description paragraph/Opinion paragraph/Details paragraph/Comparison paragraph.
- Evaluating the assets' managing policy.
- Evaluating the liquidity position.
- Evaluating the growth rate policy.
Please please please answer quickly // step by step &... details.
EXHIBIT 2.2 Sage Inc. Common Size Balance Sheets (Percent) 2013 2012 2011 2010 2009 9.8 13.7 18.8 20.4 20.0 9.4 49.4 0.5 69.1 11.0 48.4 1.0 74.1 7.6 45.0 1.6 73.0 6.6 40.1 2.4 69.5 6.8 39.7 2.6 69.1 0.8 19.2 22.6 1.1 15.7 18.1 1.2 14.4 17.3 1.4 14.1 15.9 1.4 145 16.5 (9.9) (6.9) 26.0 25.0 (12.1) 30.5 0.3 0.1 100.0 0.4 Assets Current Assets Cash and cash equivalents Accounts receivable, less allowance for doubtful accounts Inventories Prepaid expenses Total current assets Property, Plant, and Equipment Land Buildings and leasehold improvements Equipment Less accumulated depreciation and amortization Net property, plant, and equipment Goodwill Other Assets Total Assets Liabilities and Stockholders' Equity Current Liabilities Accounts payable Accrued liabilities Income taxes payable Short-term debt Current maturities of long-term debt Total current liabilities Deferred Federal Income Taxes Long-Term Debt Total liabilities Stockholders' Equity Common stock and additional paid-in capital Retained earnings Total stockholders' equity Total Liabilities and Stockholders' Equity 0.4 (3.1) 28.3 0.5 1.7 100.0 (3.0) 29.4 0.5 1.0 100.0 0.5 100.0 0.6 100.0 15.0 10.0 11.4 5.8 11.8 4.5 1.2 1.2 7.9 1.6 5.9 2.0 28.8 0.9 22.1 51.8 2.0 26.9 0.8 22.4 50.1 13.1 9.2 1.4 6.2 24 32.3 0.7 16.2 49.2 1.3 4.4 2.4 25.9 0.5 2.6 24.4 0.4 14.9 39.7 40.8 7.3 6.0 42.2 8.0 42.8 50.8 42.6 8.9 50.3 59.2 9.3 51.0 48.2 100.0 49.9 100.0 60.3 100.0 100.0 100.0 EXHIBIT 2.2 Sage Inc. Common Size Balance Sheets (Percent) 2013 2012 2011 2010 2009 9.8 13.7 18.8 20.4 20.0 9.4 49.4 0.5 69.1 11.0 48.4 1.0 74.1 7.6 45.0 1.6 73.0 6.6 40.1 2.4 69.5 6.8 39.7 2.6 69.1 0.8 19.2 22.6 1.1 15.7 18.1 1.2 14.4 17.3 1.4 14.1 15.9 1.4 145 16.5 (9.9) (6.9) 26.0 25.0 (12.1) 30.5 0.3 0.1 100.0 0.4 Assets Current Assets Cash and cash equivalents Accounts receivable, less allowance for doubtful accounts Inventories Prepaid expenses Total current assets Property, Plant, and Equipment Land Buildings and leasehold improvements Equipment Less accumulated depreciation and amortization Net property, plant, and equipment Goodwill Other Assets Total Assets Liabilities and Stockholders' Equity Current Liabilities Accounts payable Accrued liabilities Income taxes payable Short-term debt Current maturities of long-term debt Total current liabilities Deferred Federal Income Taxes Long-Term Debt Total liabilities Stockholders' Equity Common stock and additional paid-in capital Retained earnings Total stockholders' equity Total Liabilities and Stockholders' Equity 0.4 (3.1) 28.3 0.5 1.7 100.0 (3.0) 29.4 0.5 1.0 100.0 0.5 100.0 0.6 100.0 15.0 10.0 11.4 5.8 11.8 4.5 1.2 1.2 7.9 1.6 5.9 2.0 28.8 0.9 22.1 51.8 2.0 26.9 0.8 22.4 50.1 13.1 9.2 1.4 6.2 24 32.3 0.7 16.2 49.2 1.3 4.4 2.4 25.9 0.5 2.6 24.4 0.4 14.9 39.7 40.8 7.3 6.0 42.2 8.0 42.8 50.8 42.6 8.9 50.3 59.2 9.3 51.0 48.2 100.0 49.9 100.0 60.3 100.0 100.0 100.0
Step by Step Solution
There are 3 Steps involved in it

Get step-by-step solutions from verified subject matter experts