

Question: please please please help me out! im so lost! use the pdf's to solve the questions in the picture please! God bless you and Happy

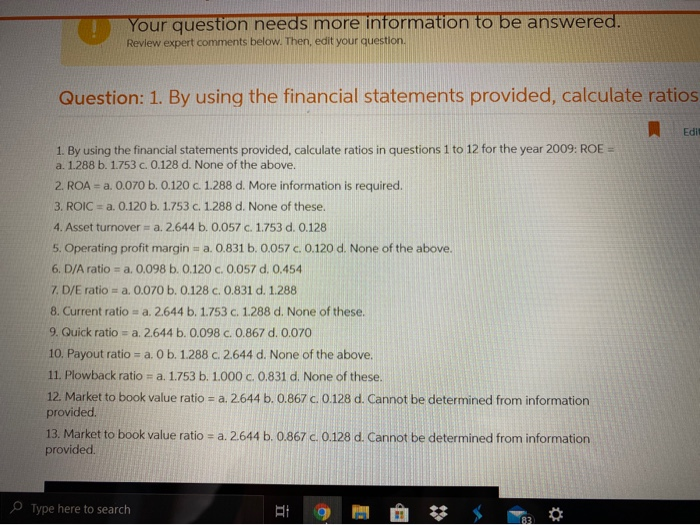
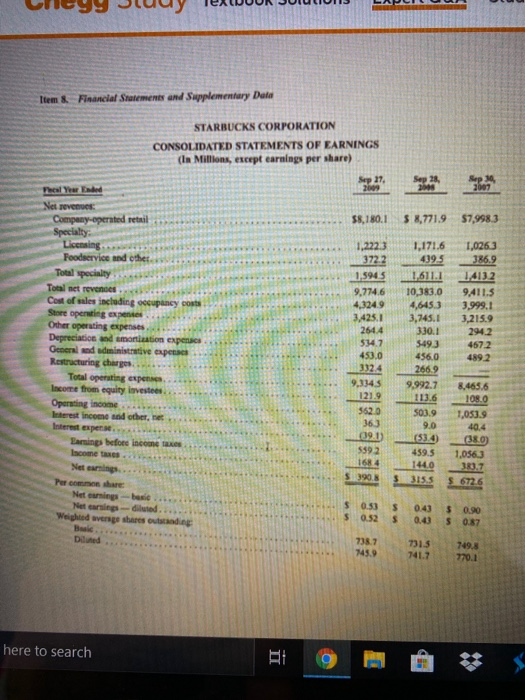
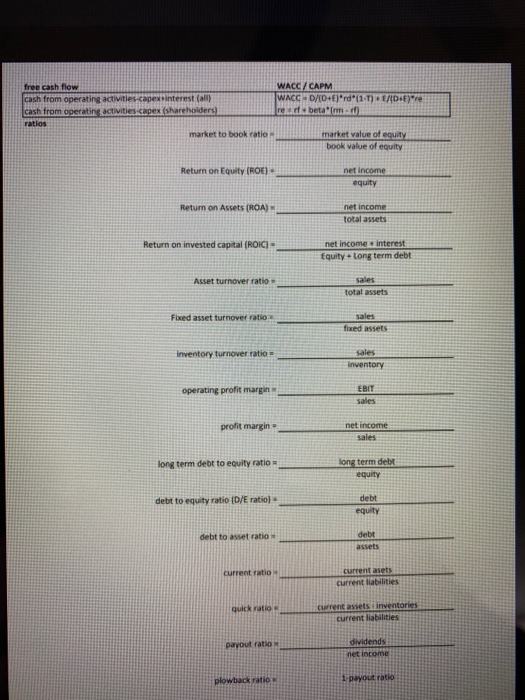
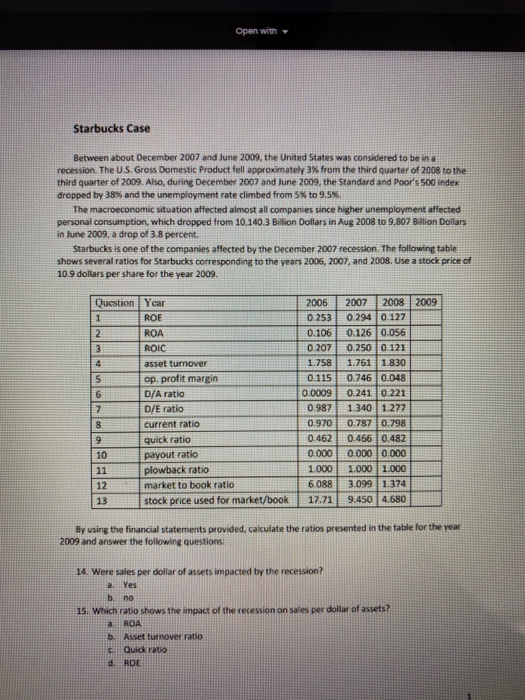

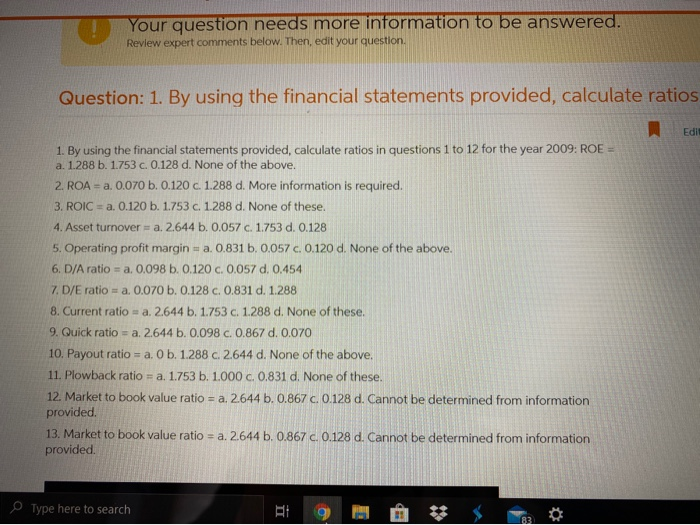


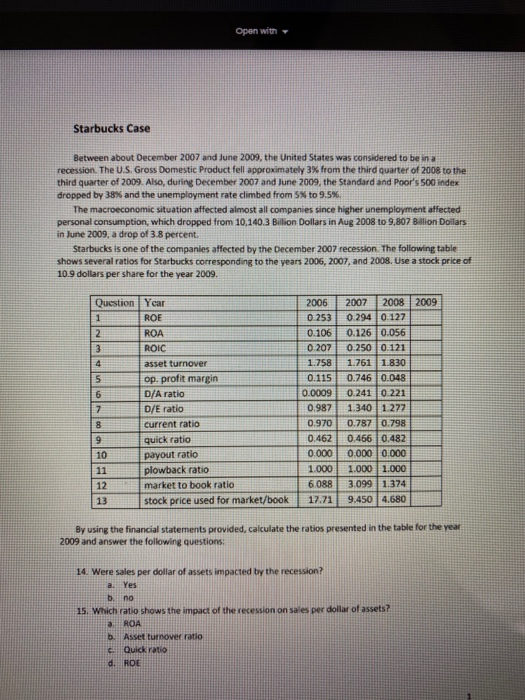
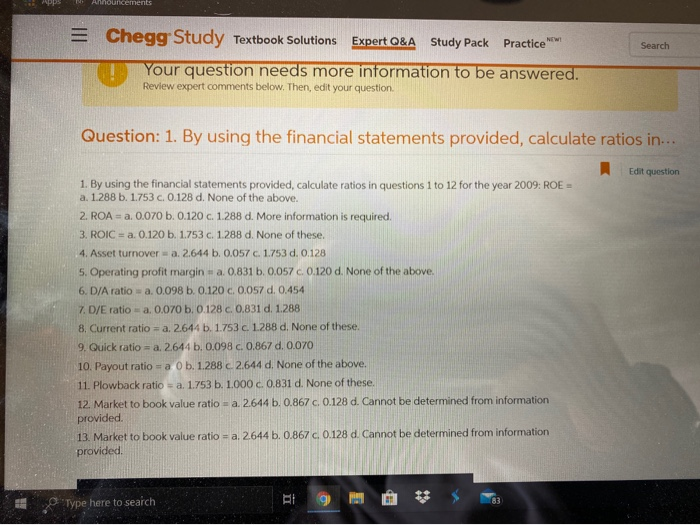
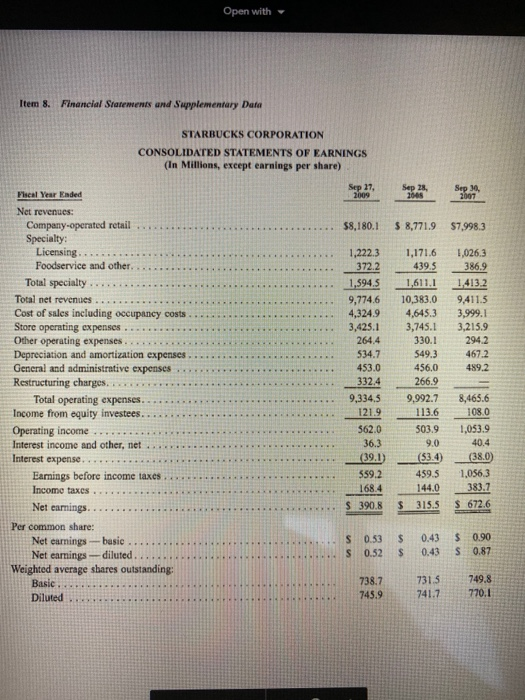
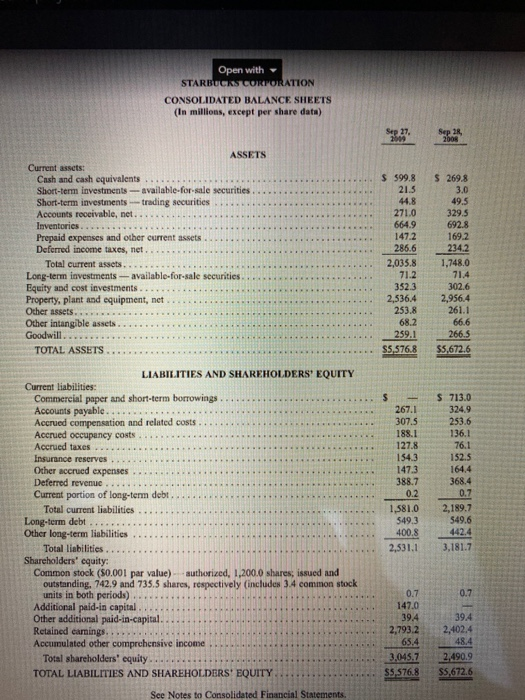
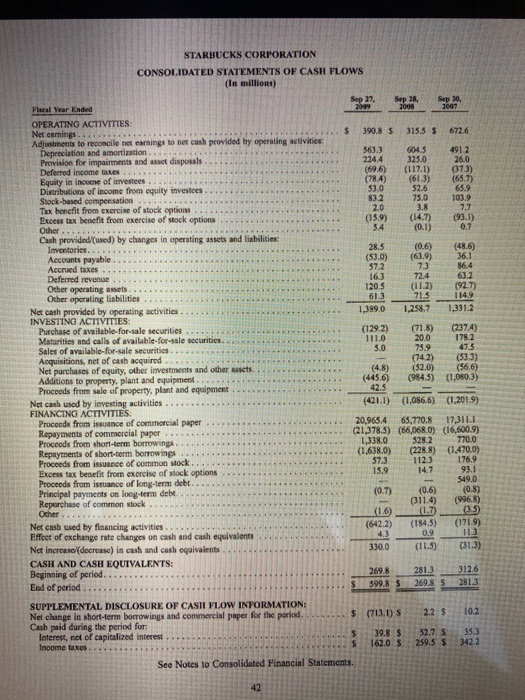
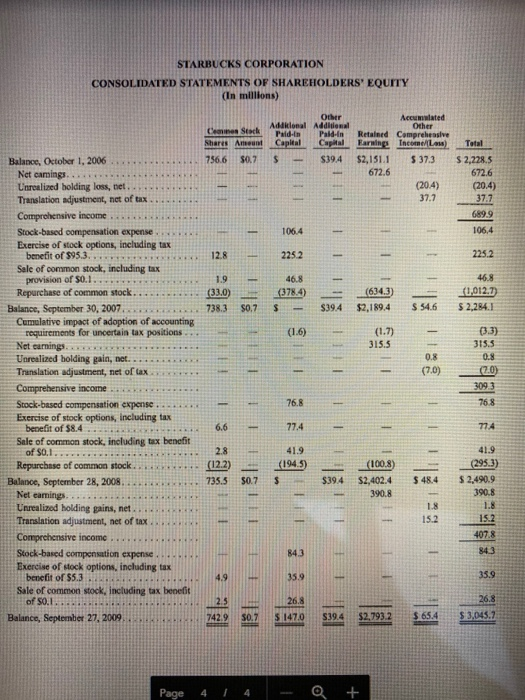
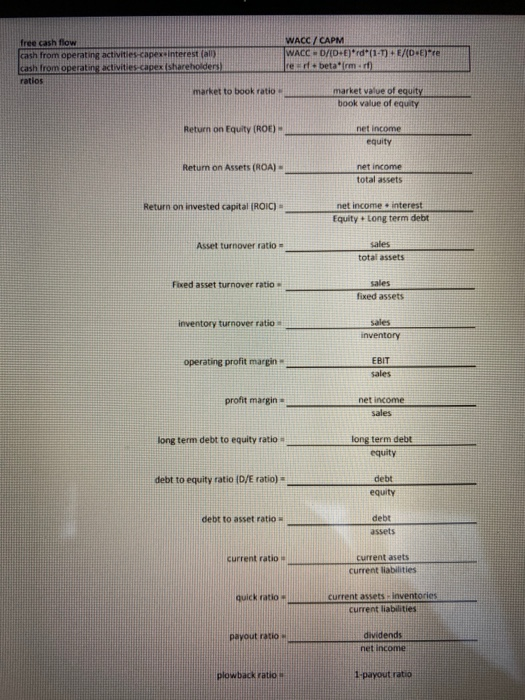
ADDS Announcements = Search Chegg Study Textbook Solutions Expert Q&A Study Pack Practice Your question needs more information to be answered. Review expert comments below. Then, edit your question Question: 1. By using the financial statements provided, calculate ratios in... Edit question 1. By using the financial statements provided, calculate ratios in questions 1 to 12 for the year 2009: ROE = a. 1.288 b. 1.753 c. 0.128 d. None of the above. 2. ROA = a. 0.070 b. 0.120 c. 1.288 d. More information is required. 3. ROIC = a. 0.120 b. 1.753 c. 1.288 d. None of these 4. Asset turnover - a. 2.644 b. 0.057 c. 1.753 d. 0.128 5. Operating profit margin = a. 0.831 b. 0.057 c. 0.120 d. None of the above. 6. D/A ratio a. 0.098 b. 0.120 c. 0.057 d. 0.454 7. D/E ratio=a. 0.070 b. 0.128 c 0.831 d. 1.288 8. Current ratio=a.2644 b. 1753c 1.288 d. None of these. 9. Quick ratio = a. 2644 b. 0.098 c. 0.867 d. 0.070 10. Payout ratio - a Ob. 1.288c2.644 d. None of the above. 11. Plowback ratio=a. 1.753 b. 1.000 c. 0.831 d. None of these. 12. Market to book value ratio a. 2.644 b. 0.867c0.128 d. Cannot be determined from information provided. 13. Market to book value ratio=a.2644 b. 0.867 c 0.128 d. Cannot be determined from information provided Type here to search Your question needs more information to be answered. Review expert comments below. Then, edit your question Question: 1. By using the financial statements provided, calculate ratios Edit 1. By using the financial statements provided, calculate ratios in questions 1 to 12 for the year 2009: ROE a. 1.288 b. 1.753 c.0.128 d. None of the above. 2. ROA - a. 0.070 b. 0.120 C. 1.288 d. More information is required. 3. ROIC = a. 0.120 b. 1.753 c. 1.288 d. None of these. 4. Asset turnover = a. 2.644 b. 0.057 c. 1.753 d. 0.128 5. Operating profit margin = a. 0.831 b. 0.057 c. 0.120 d. None of the above. 6. D/A ratio = a, 0.098 b. 0.120 c. 0.057 d. 0.454 7. D/E ratio = a. 0.070 b. 0.128 c 0.831 d. 1.288 8. Current ratio = a. 2.644 b. 1.753 c. 1.288 d. None of these. 9. Quick ratio = a. 2.644 b. 0.098 c. 0.867 d. 0.070 10. Payout ratio=a. O b. 1.288 c. 2.644 d. None of the above. 11. Plowback ratio a. 1.753 b. 1.000 c. 0.831 d. None of these. 12. Market to book value ratio = a. 2644 b. 0.867 c.0.128 d. Cannot be determined from information provided. 13. Market to book value ratio = a.2.644 b. 0.867 c.0.128 d. Cannot be determined from information provided. Type here to search Clicy9 Slucy TexWUUR JUIULIUS Item & Financial Statements and Supplementary Data STARBUCKS CORPORATION CONSOLIDATED STATEMENTS OF EARNINGS (in Millions, except earnings per share) Pheal Year Ended 58,180.1 58,771.9 $7,998.3 12723 3722 1.5945 9.774.6 Net revens: Company operated retail Specialty Liscing Foodservice and other Total specialty Total net revenues... Cost of sales including occupancy Store operating expenses Other operating expenses Depreciation and mortation expena General ad dinistrative exped Restructuring charges... Total operating expenses Income from equity investees.... Operating income Interest income and other, net Interest expens Barsings before income comes 1,171,6 4395 1,611. 1 10,383.0 4,645.3 3,745.1 3301 5493 456.0 266.9 1,0263 386.9 1.4132 9,411.5 3,999.1 3.215.9 294.2 4672 4892 8.465.6 NORLO S019 1.050.9 1,0563 Net aurings-bese Net caring-diluted Weighted average shares tanding $ 0.43 0.41 0.90 0.87 Duned... 738.7 7315 749.8 2201 here to search Bt 9 free cash flow cash from operating activities capex interest (ally cash from operating activities capex (shareholders WACC/CAPM WACC D/CD+E)*rd (1.) ./ reb etaum-10 F)re market to book ratio market value of equity book value of equity Return on Equity (ROE) net income equity Return on Assets (ROA) net income total assets Return on invested capital (ROIC) - net income interest Equity long term debt Asset turnover ratio- sales total assets Fixed asset turnover ratio sales fixed assets inventory turnover ratio = sales inventory operating profit margin profit margin- net income sales long term debt to equity ratio long term debt equity debt to equity ratio D/E ratio) debt equity debt to asset ratio debt assets current asets current liabilities quick ratio current liabilities payout ratio net income payout ratio Open with Starbucks Case Between about December 2007 and June 2009, the United States was considered to beina recession. The U.S. Gross Domestic Product fell approximately 3% from the third quarter of 2008 to the third quarter of 2009. Also, during December 2007 and June 2009, the Standard and Poor's 500 index dropped by 38% and the unemployment rate climbed from 5% to 9.5%. The macroeconomic situation affected almost all companies since higher unemployment affected personal consumption, which dropped from 10.140.3 Billion Dollars in Aug 2008 to 9.807 Billion Dollars in June 2009, a drop of 3.8 percent. Starbucks is one of the companies affected by the December 2007 recession. The following table shows several ratios for Starbucks corresponding to the years 2006, 2007, and 2008. Use a stock price of 10.9 dollars per share for the year 2009 JUNHO Question Year ROE ROA ROIC asset turnover op. profit margin D/A ratio D/E ratio current ratio quick ratio payout ratio plowback ratio 12 market to book ratio stock price used for market/book 2006 0.253 0.106 0.207 1.758 0.115 0.0009 0.987 0.970 0.462 0.000 1.000 6088 17.71 2007 2008 2009 0.294 0.127 0.126 0.056 0.250 0.121 1.761 1.830 0.746 0.048 0.241 0.221 1340 1.277 0.787 0.798 0.466 0.482 0.000 0.000 1.000 1.000 3.099 1.374 9.450 4.680 By using the financial statements provided, calculate the ratios presented in the table for the year 2009 and answer the following questions: 14. Were sales per dollar of assets impacted by the recession? a. Yes bno 15. Which ratio shows the impact of the recession on sales per dollar of assets? a ROA b. Asset turnover ratio c. Quick ratio Apps Announcements = Search Chegg Study Textbook Solutions Expert Q&A Study Pack Practice w Your question needs more information to be answered. Review expert comments below. Then, edit your question Question: 1. By using the financial statements provided, calculate ratios in... Edit question 1. By using the financial statements provided, calculate ratios in questions 1 to 12 for the year 2009: ROE = a. 1.288 b. 1.753 c. 0.128 d. None of the above. 2. ROA = a. 0.070 b. 0.120 c. 1.288 d. More information is required. 3. ROIC = a. 0.120 b. 1.753 c. 1.288 d. None of these 4. Asset turnover = a. 2.644 b. 0.057 c. 1.753 d. 0.128 5. Operating profit margin - a. 0.831 b. 0.057 c 0.120 d. None of the above. 6. D/A ratio - a. 0.098 b. 0.120 c 0.057 d. 0.454 7. D/E ratio-a, 0.070 b. 0.128 c 0.831 d. 1.288 8. Current ratio=a.2644 b. 1753c 1.288 d. None of these. 9. Quick ratio = a. 2644 b. 0.098 c. 0.867 d. 0.070 10. Payout ratio - a Ob. 1.288 C 2.644 d. None of the above. 11. Plowback ratio - a. 1.753 b. 1.000 c.0.831 d. None of these. 12. Market to book value ratio-a. 2.644 b. 0.867c0.128 d. Cannot be determined from information provided. 13. Market to book value ratio=a.2644 b. 0.867 c 0.128 d. Cannot be determined from information provided Type here to search Your question needs more information to be answered. Review expert comments below. Then, edit your question Question: 1. By using the financial statements provided, calculate ratios Edit 1. By using the financial statements provided, calculate ratios in questions 1 to 12 for the year 2009: ROE a. 1.288 b. 1.753 c.0.128 d. None of the above. 2. ROA - a. 0.070 b. 0.120 C. 1.288 d. More information is required. 3. ROIC = a. 0.120 b. 1.753 c. 1.288 d. None of these. 4. Asset turnover = a. 2.644 b. 0.057 c. 1.753 d. 0.128 5. Operating profit margin = a. 0.831 b. 0.057 c. 0.120 d. None of the above. 6. D/A ratio = a, 0.098 b. 0.120 c. 0.057 d. 0.454 7. D/E ratio = a. 0.070 b. 0.128 c 0.831 d. 1.288 8. Current ratio = a. 2.644 b. 1.753 c. 1.288 d. None of these, 9. Quick ratio = a. 2.644 b. 0.098 c 0.867 d. 0.070 10. Payout ratio=a. O b. 1.288 c. 2.644 d. None of the above. 11. Plowback ratio = a. 1.753 b. 1.000 c. 0.831 d. None of these. 12. Market to book value ratio = a. 2644 b. 0.867 c.0.128 d. Cannot be determined from information provided. 13. Market to book value ratio = a.2.644 b. 0.867 c.0.128 d. Cannot be determined from information provided Type here to search Clicy9 Juuy TexWUUR JUILLION Item & Financial Statements and Supplementary Date STARBUCKS CORPORATION CONSOLIDATED STATEMENTS OF EARNINGS (in Millions, except earnings per share) 58,180.1 5 8,771.9 $7,998.3 12723 1.594 5 9.774.6 Net revenues Company operated retail Specialty Licensing Foodservice and other Total specialty Total net revenues. . Cost of sales including occupancy Store operating expenses Other operating expenses Depreciation and amortization expens General and ministrative expense Restructuring charges.. Total operating expenses Income from equity investees.... Operating income Interest income and other, net Interest expert E s before con Income taxes 1,171,6 439. 5 1,611.1 10,383.0 4,645.3 3,745.1 3301 5493 456.0 266.9 1,0263 386.9 1.4132 9,411.5 3,999.1 3.215.9 294.2 4672 489 2 8.465.6 1080 113.6 SO3.9 1.053.9 1,056) Netering Per c here Net earnings-bes Net caring-diluted Weighted average shares 031 $ $ 0.90 0 and 0.43 Dild. 738.7 731.5 741.7 749,8 here to search free cash flow cash from operating activities.capex interest (ally cash from operating activities capex (shareholders WACC/CAPM WACC-D/CD+EJrd (1-1) rearbeta imm-10) /(DIE)re market to book ratio market value of equity book value of equity Return on Equity (ROE) - net income equity Return on Assets (ROA) net income total assets Return on invested capital (OIC) - net income interest Equity Long term debt Asset turnover ratio- sales total assets Fixed asset turnover ratio Sales fixed assets inventory turnover ratio = sales inventory operating profit margin profit margin- net income sales long term debt to equity ratio = long term debet equity debt to equity ratio (D/E ratio) debt equity debt to asset ratio debt assets current liabilities Inventories current liabilities payout ratio net income payout ratio Open with Starbucks Case Between about December 2007 and June 2009, the United States was considered to beina recession. The U.S. Gross Domestic Product fell approximately 3% from the third quarter of 2008 to the third quarter of 2009. Also, during December 2007 and June 2009, the Standard and Poor's 500 index dropped by 38% and the unemployment rate climbed from 5% to 9.5% The macroeconomic situation affected almost all companies since higher unemployment affected personal consumption, which dropped from 10.140.3 Billion Dollars in Aug 2008 to 9.807 Billion Dollars in June 2009, a drop of 3.8 percent. Starbucks is one of the companies affected by the December 2007 recession. The following table shows several ratios for Starbucks corresponding to the years 2006, 2007, and 2008. Use a stock price of 10.9 dollars per share for the year 2009. 2009 Question Year ROE ROA ROIC asset turnover op. profit margin D/A ratio D/E ratio current ratio quick ratio payout ratio plowback ratio market to book ratio stock price used for market/book 2006 0.253 0.106 0.207 1.758 0.115 0.0009 0.987 0.970 0.462 0.000 1.000 6088 17.71 2007 2008 0.294 0.127 0.126 0.056 0.250 0.121 1.761 1.830 0.746 0.048 0.241 0.221 1.340 1.277 0.787 0.798 0.466 0.482 0.000 0.000 1.000 1.000 3.099 1.374 9.450 4.680 12 By using the financial statements provided, calculate the ratios presented in the table for the year 2009 and answer the following questions: 14. Were sales per dollar of assets impacted by the recession? Yes b.no 15. Which ratio shows the impact of the recession on sales per dollar of assets? ROA b. Asset turnover ratio c. Quick ratio Apps Announcements = Search Chegg Study Textbook Solutions Expert Q&A Study Pack Practice w Your question needs more information to be answered. Review expert comments below. Then, edit your question Question: 1. By using the financial statements provided, calculate ratios in... Edit question 1. By using the financial statements provided, calculate ratios in questions 1 to 12 for the year 2009: ROE = a. 1.288 b. 1.753 c. 0.128 d. None of the above. 2. ROA = a. 0.070 b. 0.120 c. 1.288 d. More information is required. 3. ROIC = a. 0.120 b. 1.753 c. 1.288 d. None of these 4. Asset turnover = a. 2.644 b. 0.057 c. 1.753 d. 0.128 5. Operating profit margin - a. 0.831 b. 0.057 c 0.120 d. None of the above. 6. D/A ratio - a. 0.098 b. 0.120 c 0.057 d. 0.454 7. D/E ratio-a, 0.070 b. 0.128 c 0.831 d. 1.288 8. Current ratio=a.2644 b. 1753c 1.288 d. None of these. 9. Quick ratio = a. 2644 b. 0.098 c. 0.867 d. 0.070 10. Payout ratio - a Ob. 1.288 C 2.644 d. None of the above. 11. Plowback ratio - a. 1.753 b. 1.000 c.0.831 d. None of these. 12. Market to book value ratio-a. 2.644 b. 0.867c0.128 d. Cannot be determined from information provided. 13. Market to book value ratio=a.2644 b. 0.867 c 0.128 d. Cannot be determined from information provided Type here to search Open with Item 8. Financial Statements and Supplementary Data STARBUCKS CORPORATION CONSOLIDATED STATEMENTS OF EARNINGS (in Millions, except earnings per share) Piscal Year Ended $8.180.1 $ 8,771.9 $7,998.3 1,171.6 439.5 1,611.1 10,383.0 4,645. 3 3,745.1 3 1.026.3 386.9 1.413.2 9,411.5 ,999.1 3,215,9 294.2 467.2 489.2 Net revenues: Company-operated retail. Specialty: Licensing ... Foodservice and other.... Total specialty ........ Total net revenues..... Cost of sales including occupancy costs. Store operating expenses .. Other operating expenses..... Depreciation and amortization expenses General and administrative expenses Restructuring charges.... Total operating expenses. Income from equity investees. Operating income .... Interest income and other, net Interest expense. Eamings before income taxes Income taxes Net earnings... Per common share: Net earnings-basic ....... Net earnings-diluted....... Weighted average shares outstanding: Basic.... Diluted ... 1,222.3 372.2 1,594.5 9,774.6 4,324.9 3,425.1 264.4 534.7 453.0 332.4 9,334.5 121.9 562.0 36.3 (39.1) 559.2 168.4 $ 390.8 549.3 456.0 266.9 9,992.7 113.6 503.9 90 (534) 459.5 144.0 315.5 8,465.6 108.0 1,053.9 40.4 (38.0) 1,0563 383.7 $ 672.6 $ S S 0.53 0.52 $ $ 0.43 0.43 $ S 0.90 0.87 738.7 731.5 741. 7 749.8 770.1 745.9 Open with STARBUCKS CORPORATION CONSOLIDATED BALANCE SHEETS (In millions, except per share data) ASSETS $ 269,8 3.0 49.5 Current assets: Cash and cash equivalents .... Short-term investments - available for sale securities Short-term investments-trading securities .. Accounts receivable, net.. Inventories....... Prepaid expenses and other current assets Deferred income taxes, net.... Total current assets....... Long-term investments available-for-sale securities Equity and cost investments.. Property, plant and equipment, net. Other assets... ....... Other intangible assets.... Goodwill..... TOTAL ASSETS... $ 599.8 21.5 44.8 271.0 6649 147.2 286.6 2,035.8 71.2 352.3 2,536.4 253.8 68.2 259.1 $5,576.8 3295 692.8 169.2 234.2 1,748.0 71.4 302.6 2,956.4 261.1 66.6 266.5 $5,672.6 S713.0 253.6 136.1 267.1 307.5 188.1 127.8 154.3 147.3 388.7 76.1 152.5 164.4 368.4 1.581.0 5493 LIABILITIES AND SHAREHOLDERS' EQUITY Current liabilities: Commercial paper and short-term borrowings... Accounts payable...... Accrued compensation and related costs.. Accrued occupancy costs Accrued taxes... Insurance reserves .... Other accrued expenses Deferred revenue Current portion of long-term debt.. Total current liabilities Long-term debt.. Other long-term liabilities .. Total liabilities. Shareholders' cquity: Common stock (50.001 par value) authorized, 1,200.0 shares, issued and outstanding, 742.9 and 735.5 shares, respectively includes 3.4 common stock units in both periods). Additional paid-in capital Other additional paid-in-capital Retained earnings.... Accumulated other comprchensive income Total shareholders' equity TOTAL LIABILITIES AND SHAREHOLDERS' EQUITY See Notes to Consolidated Financial Statements 2.189.7 549.6 442.4 2,531.1 3.181.7 147.0 39.4 2,793.2 2.402.4 3.045.7 2.490.9 $5,672.6 S5 $76.8 STARBUCKS CORPORATION CONSOLIDATED STATEMENTS OF CASH FLOWS (in millions) 672.6 491.2 26.0 (373) (657) 65.9 103.9 7.7 (93.1) (0.1) (486) 36.1 86.4 632 (92.7) 1.2012 (237.4) 178.2 47.5 (53.3) (566) (1,080.3) Fheal Year Ended OPERATING ACTIVITIES Net earnings ..... 390.8 5 315.5 $ . Adjustments to reconcile net earnings to net cash provided by operating activities Depreciation and amortization.. 604.5 Provision for impairments and asset disposals 224.4 325.0 Deferred income taxes......... (696) (117.1) Equity in income of investees (61.3) Distributions of income from equity investees Stock-based compensation 75.0 Tax bencfit from exercise of stock options ... Excess tax benefit from exercise of stock options (159) (14.7) Other .... Cash provided(used) by changes in operating assets and liabilities Inventorics...... 28.5 (0.6) Accounts payable..... (53.0) (63.9) Accrued taxes ...... Deferred revenue... Other operating assets..... 120.5 (12) Other operating liabilities ..... Net cash provided by operating activities 1399.0 INVESTING ACTIVITIES: Purchase of available for sale securities (129.2) (71.8) Maturities and calls of available for sale securities 1110 20.0 Sales of available-for-sale securities..... 5.0 75.9 Acquisitions, net of cash acquired ........ (742) Net purchases of equity, other investments and other assets (4.8) (520) Additions to property, plant and equipment .... (4456 (984.5) Proceeds from sale of property, plant and equipment 42.5 Net cash used by investing activities. (421.1) (1,086.6) FINANCING ACTIVITIES Proceeds from issuance of commercial paper 20,965.4 65,770. 8 Repayments of commercial paper .... (21.378.5) (66,068 0) Proceeds from short-term borrowings... 1,338.0 528.2 Repayments of sbort-term borrowings (1,638.0) (2288) Proceeds from issuance of common Mock... 5731123 Excess tax benefit from exercise of stock options 14.7 Proceeds from issuance of long-term debt Principal payments on long-term debt. (0.6) Repurchase of common stock ... (311.4) Other ... (1.6) Net cash used by financing activities... (642.2) Effect of exchange rate changes on cash and cash equivalent Net increaso (decrease) in cash and cash equivalents 330.0 CASH AND CASH EQUIVALENTS: Beginning of period. ..... 269.8 End of period ..... $ 599,8 SUPPLEMENTAL DISCLOSURE OF CASII FLOW INFORMATION: Nel change in short-term borrowings and commercial paper for the period.... (713.1) S Cash paid during the period for: 39.8 Interest, net of capitalized interest $ 52.7 Income taxes. See Notes to Consolidated Financial Statements: (1,201.9) 17,311.1 (16.800.9) 770.0 (1.470.0) 176.9 93.1 549.0 10.89 (996.8) 15.9 (0.7) (184,5) (171.9) S STARBUCKS CORPORATION CONSOLIDATED STATEMENTS OF SHAREHOLDERS' EQUITY In millions) Ceinen Stack Other Aditional Additional Paid-in Pald-in Capital Capital Accumulated Other Retained Comprehensive Earnings Income Laus) $2,1511 $ 37.3 $39.4 672.6 (20.4) 37.7 $2,228.5 672.6 (20.4) 37.7 6899 106,4 106.4 12.8 2252 225.2 (634.3) (33.0) 738.3 46.8 1,012.7) $ 2.284.1 0.7 $39.4 $2,189.4 (1.6) (1.7) 315.5 (3.3) 3155 (7.0) Balance, October 1, 2006 Net camings... Unrealized holding loss, bet.. Translation adjustment, net of tax Comprehensive income Stock-based compensation expense.. Exercise of stock options, including tax benefit of $95.3.... Sale of common stock, including tax provision of $0.1...... Repurchase of common stock......... Balance, September 30, 2007.. . Cumulative impact of adoption of accounting requirements for uncertain tax positions Net carning.v n Unrealized holding gain, net... Translation adjustment, net of tax Comprehensive income Stock-based compensation expense... Exercise of stock options, including tax benefit of $8.4 .. Sale of common stock, including tax benefit of $0.1.. Repurchase of common stock Balance, September 28, 2008....... Net camnings. Unrealized holding gains, net. Translation adjustment, net of tax Comprehensive income Stock-based compensation expense.. Exercise of stock options, including tax benefit of $5.3. Sale of common stock, including tax benefit of 0.1 Balance, September 27, 2009 76.8 6.6 77.4 77.4 41.9 (1945) (100.8) (122) 735.5 12 41.9 (295.3) S2,490.9 390.8 $39.4 $48.4 $2,402.4 390.8 7429 so $ 147.0 $1879 594 32.7932 $2,7932 654 $ 3,045.7 Page 4 / 4 - Q + cash from operating activities-capex interest WACC/CAPM WACC-D/CD+E)*rd (1-7)+E/(0-E) re rearbetarm ) Cash from operating activities agen shareho market to book ratio market value of equity book value of equity Return on Equity (ROE) net income equity Return on Assets (ROA) - net income total assets Return on invested capital (ROIC) _ net income interest Equity + Long term debt Asset turnover ratio- total assets Fixed asset turnover ratio sales fixed assets inventory turnover ratio Sales inventory operating profit margin EBIT sales profit margin- net income sales long term debt to equity ratio _ long term debt equity debt to equity ratio (D/E ratio) = debt equity debt to asset ratio debt current asets current liabilities current assets inventories current liabilities payout ratio dividends 1-payout ratio
Step by Step Solution
There are 3 Steps involved in it

Get step-by-step solutions from verified subject matter experts