

Question: Please Please use MATLAB, and if you could have the code transcribed that would be awesome! Thank you! PROBLEM 1. What are the dimensions of
Please Please use MATLAB, and if you could have the code transcribed that would be awesome! Thank you!
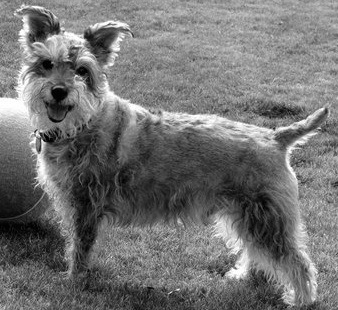
PROBLEM 1. What are the dimensions of U, S, and V? (Find out by typing size(U)-without the semicolon-and likewise for the others) Here S has more cohumns than rows; in fact, columns 311 to 338 are all zeros (When A has more columns than rows. we pad S on the right with zero columns to turn S into an m n matrix ). Otherwise, with this modification, the SVD is just like Eq. (L6.1) PROBLEM 2. Compute the best rank-1 approximation to B and store it in the matrix rank1 (Use the commands given in the Example parts (a) and (b) on page 2, but applied to the matrix B, rather than A. Makke sure you suppress the output ). Step 3. Let's visualize rank1. To do that, first create C-zeros(size CA)) This creates an array of zeros, C, of the same dimension as the original image matrix A Step 4. Copy the rank-1 image into C as follows: CC1)ranki cC..2)ranki c3-rank; Include the code and the figure in your report. Step 5: We are almost done, except for one hitch. MATLAB does all its scaling using values from 0 to 1 (and maps them to values between 0 and 256 for the graphics hardware). Lower-rank approximations to the actual image can have values that are slightly less than 0 and greater than 1. So we will truncate them to fit, as follows C-ax(o,min(1,c)) Step 6. View the resulting image: inage(C)micolon PROBLEM 3. Create and view a rank-10 approximation to the original picture (Use Steps 4-6 but with rank10 instead of ranki. If you mess up for example, you get an all-black picture then start over froam Step 3.) It is convenient to create an M-file with a for loop to evaluate Include the code and the figure. PROBLEM 4. Repeat with rank-20, 30 and 40 approximations (and any other ranks that you'd like to experiment with). What is the smallest rank that, in your opinion, gives an acceptable approximation to the original picture? In your lab write-up, include only the code that gives an acceptable approximation and the corre sponding picture. PROBLEM 1. What are the dimensions of U, S, and V? (Find out by typing size(U)-without the semicolon-and likewise for the others) Here S has more cohumns than rows; in fact, columns 311 to 338 are all zeros (When A has more columns than rows. we pad S on the right with zero columns to turn S into an m n matrix ). Otherwise, with this modification, the SVD is just like Eq. (L6.1) PROBLEM 2. Compute the best rank-1 approximation to B and store it in the matrix rank1 (Use the commands given in the Example parts (a) and (b) on page 2, but applied to the matrix B, rather than A. Makke sure you suppress the output ). Step 3. Let's visualize rank1. To do that, first create C-zeros(size CA)) This creates an array of zeros, C, of the same dimension as the original image matrix A Step 4. Copy the rank-1 image into C as follows: CC1)ranki cC..2)ranki c3-rank; Include the code and the figure in your report. Step 5: We are almost done, except for one hitch. MATLAB does all its scaling using values from 0 to 1 (and maps them to values between 0 and 256 for the graphics hardware). Lower-rank approximations to the actual image can have values that are slightly less than 0 and greater than 1. So we will truncate them to fit, as follows C-ax(o,min(1,c)) Step 6. View the resulting image: inage(C)micolon PROBLEM 3. Create and view a rank-10 approximation to the original picture (Use Steps 4-6 but with rank10 instead of ranki. If you mess up for example, you get an all-black picture then start over froam Step 3.) It is convenient to create an M-file with a for loop to evaluate Include the code and the figure. PROBLEM 4. Repeat with rank-20, 30 and 40 approximations (and any other ranks that you'd like to experiment with). What is the smallest rank that, in your opinion, gives an acceptable approximation to the original picture? In your lab write-up, include only the code that gives an acceptable approximation and the corre sponding picture
Step by Step Solution
There are 3 Steps involved in it

Get step-by-step solutions from verified subject matter experts