

Question: please please write neatly and complete every step Exercise 13-7 Analyzing liquidity LO P3 Current TE Simon Company's year-end balance sheets follow. At December Assets
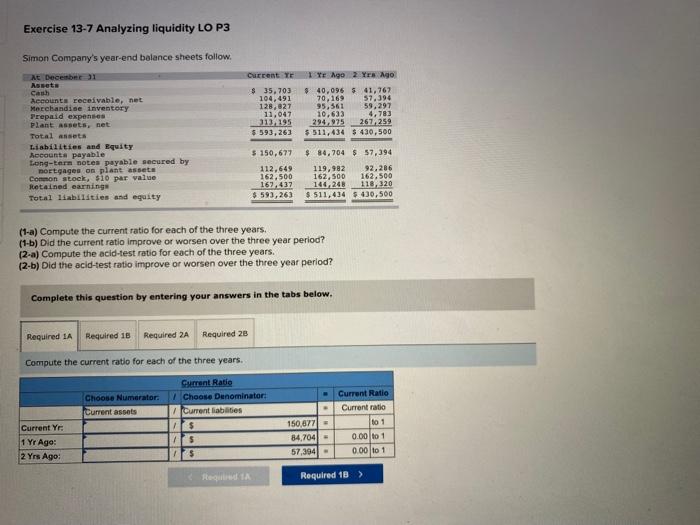
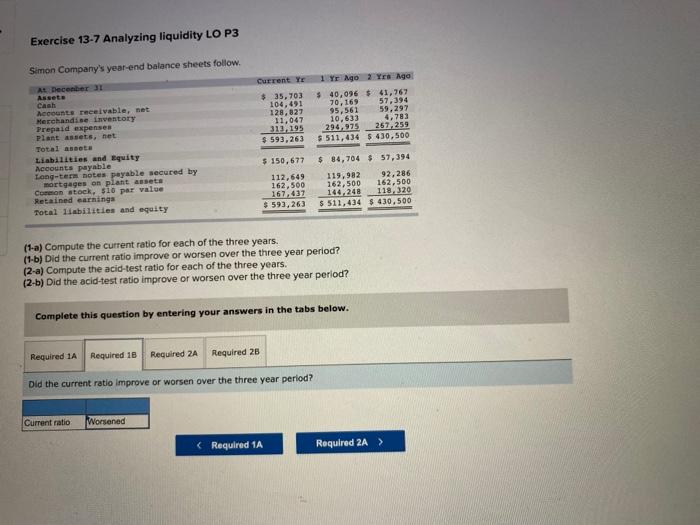
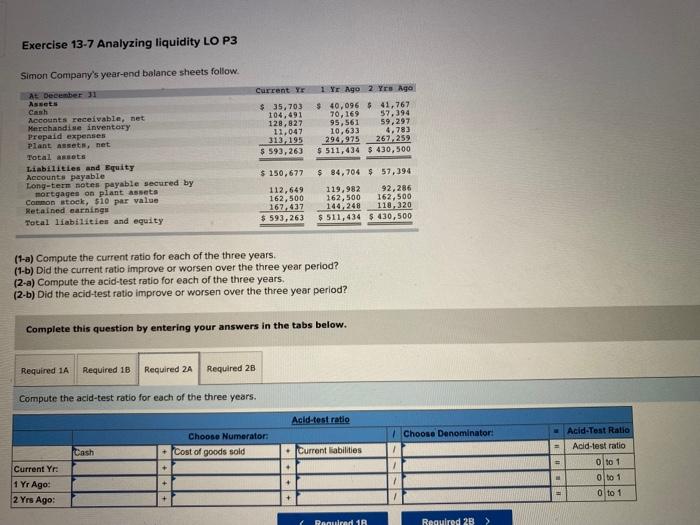
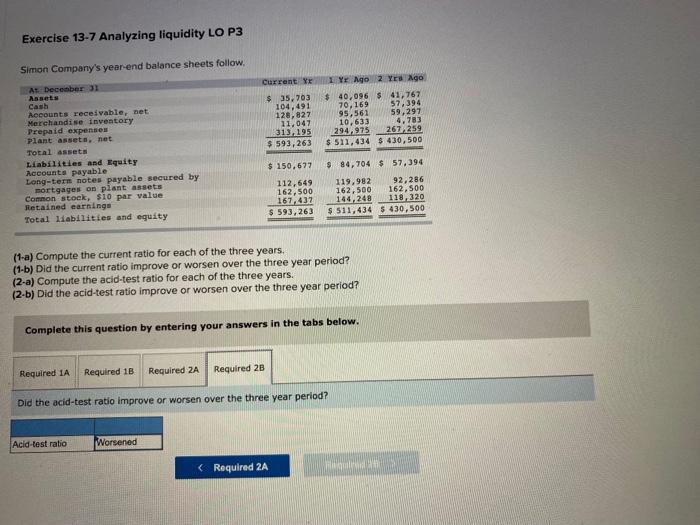
Exercise 13-7 Analyzing liquidity LO P3 Current TE Simon Company's year-end balance sheets follow. At December Assets Cau Recounts receivable, net Merchandise inventory Prepaid expenses plant assets, net Total ansets Liabilities and Equity Accounts payable Long-term notes payable secured by nortgages on plant assets Connon stock, 510 par valve Retained earnings Total liabilities and equity $ 35,703 104,491 128,027 11,047 313,195 $ 593,263 TY Ago 2 Yes Ago $ 40,096 541,767 70,169 57,394 95.561 59,297 10,633 4.783 294,975 267.259 $ 511,434 $ 430,500 $ 150,677 112.649 162.500 167.437 $ 593,263 $ 84,704 $ 57,394 119,982 92,286 162,500 162,500 146,243 118,320 $ 511,434 $430,500 (1-a) Compute current ratio for each of the three years. (1-b) Did the current ratio improve or worsen over the three year period? (2-a) Compute the acid-test ratio for each of the three years. (2-b) Did the acid-test ratio improve or worsen over the three year period? Complete this question by entering your answers in the tabs below. Required LA Required 18 Required 2A Required 28 Compute the current ratio for each of the three years. Current Ratio Choose Numerator Choose Denominator: Current assets Current liabilities Current Yr $ 1 Yr Ago: $ 2 Yrs Ago: IS 150,877 = 84,704 - 57,394 - Current Ratio Current ratio to 1 0.00 to 1 0.00 to 1 Reg 1A Required 18 ) Exercise 13-7 Analyzing liquidity LO P3 Simon Company's year-end balance sheets follow. At December 31 Asset Cash Accounts receivable, net Merchandise inventory Prepaid expenses Plant Assets, het Total aseta Liabilities and Equity Accounts payable Long-ter notes payable secured by mortgages on plant assets Cormon stock. $10 per value Retained earnings Total liabilities and equity Current Ye $ 35, 703 104, 491 128,827 11.047 312, 195 $ 593.263 1 Yr Ago Yr Ago $ 40,096 $ 41,767 70.169 57,394 95,561 59.297 10,633 4,783 294,975 267, 259 $ 511, 434 $430,500 $ 150,677 112.649 162,500 167,437 $ 593,263 $ 84,704 $ 57,394 119.982 92,286 162,500 162,500 144.248 118 320 $ 511,434 $ 430.500 (1-a) Compute the current ratio for each of the three years. 11-b) Did the current ratio improve or worsen over the three year period? (2-a) Compute the acid-test ratio for each of the three years. (2-b) Did the acid-test ratio improve or worsen over the three year period? Complete this question by entering your answers in the tabs below. Required 1A Required 1B Required 2A Required 25 Did the current ratio improve or worsen over the three year period? Current ratio Worsened Exercise 13-7 Analyzing liquidity LO P3 Simon Company's year-end balance sheets follow Current YE 1 Yr Ago 2 Yrs Aga $ 35,703 $ 40,096 $ 41,767 104,491 70, 169 59.394 128,827 95,561 59,297 11.047 10,633 4,783 313,195 294,975 262,259 $ 593,263 $ 511, 434 $ 430, 500 At December 31 Assets Cash Accounts receivable, net Merchandise inventory Prepaid expenses Plant Assets, net Total assets Liabilities and Equity Accounts payable Long-term notes payable secured by mortgages on plant assets Common stock, $10 par value Retained earnings Total liabilities and equity $ 150,677 112,649 162,500 167,437 $ 593,263 $ 84,704 $ 57,394 119,982 92,286 162,500 162,500 144,248 118,320 $ 511,434 $ 430,500 (1-a) Compute the current ratio for each of the three years, (1-b) Did the current ratio improve or worsen over the three year period? (2-a) Compute the acid-test ratio for each of the three years. (2-b) Did the acid-test ratio improve or worsen over the three year period? Complete this question by entering your answers in the tabs below. Required 1A Required 18 Required 2A Required 28 Compute the acid-test ratio for each of the three years. Acid-test ratio Choose Denominator: Choose Numerator: + Cost of goods sold Cash . Current liabilities ## Acid-Test Ratio Acid-test ratio 0 to 1 oto 1 O to 1 Current Yr .. 1 Yr Ago: 2 Yrs Ago +++ + Renuired 1R Required 2B > Exercise 13-7 Analyzing liquidity LO P3 Simon Company's year-end balance sheets follow, At December 31 Assets Cash Accounts receivable, net Merchandise inventory Prepaid expenses Plant assets, net Total assets Liabilities and Equity Accounts payable Long-term notes payable secured by mortgages on plant assets Common stock, $10 par value Retained earnings Total liabilities and equity Current $ 35,703 104,491 128,827 11.047 313,195 $ 593,263 1 Yr Ago 2 Y ago $ 40,096 $ 41,767 70, 169 57,394 95,561 59,297 10,633 4.783 294.975 267259 $ 511,434 $ 430,500 $ 150,677 112,649 162,500 167.432 $ 593,263 $ 84,704 $ 57,394 119.982 92,286 162,500 162,500 144, 248 118 320 $ 511, 434 $ 430,500 (1-a) Compute the current ratio for each of the three years. (1-b) Did the current ratio improve or worsen over the three year period? (2-a) Compute the acid-test ratio for each of the three years. (2-b) Did the acid-test ratio improve or worsen over the three year period? Complete this question by entering your answers in the tabs below. Required 1A Required 1B Required 2A Required 2B Did the acid-test ratio improve or worsen over the three year period? Acid-test ratio Worsened
Step by Step Solution
There are 3 Steps involved in it

Get step-by-step solutions from verified subject matter experts