

Question: Please plot this graph into mathlab Due to daily fluctuating gas costs, your company wishes to calculate the shipping cost (SC) [-] of these parts,
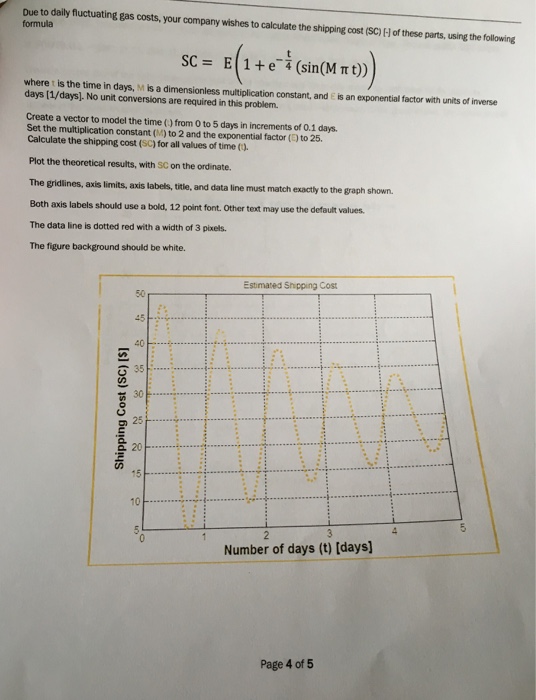
Due to daily fluctuating gas costs, your company wishes to calculate the shipping cost (SC) [-] of these parts, using the following formula SC = E (1 + e^t/4 (sin (M pi t)) where t is the time in days, M is a dimensionless multiplication constant, and epsilon is an exponential factor with units of inverse days [1/days]. No unit conversions are required in this problem. Create a vector to model the time (t) from 0 to 5 days in increments of 0.1 days. Set the multiplication constant (M) to 2 and the exponential factor (epsilon ) to 25. Calculate the shipping cost (SC) for all values of time (t). Plot the theoretical results, with SC on the ordmaie. The gridlines, axis limits, axis labels, title, and data line must match exactly to the graph shown. Both axis labels should use a bold. 12 point font Other text may use the default values. The data line a dotted rod with a width of 3 pixels. The figure background should be white
Step by Step Solution
There are 3 Steps involved in it

Get step-by-step solutions from verified subject matter experts