

Question: Please post the answer to 'c' and 'd'. See the graph I need populate. Please provide Excel table to create the graph possible to say?
Please post the answer to 'c' and 'd'. See the graph I need populate. Please provide Excel table to create the graph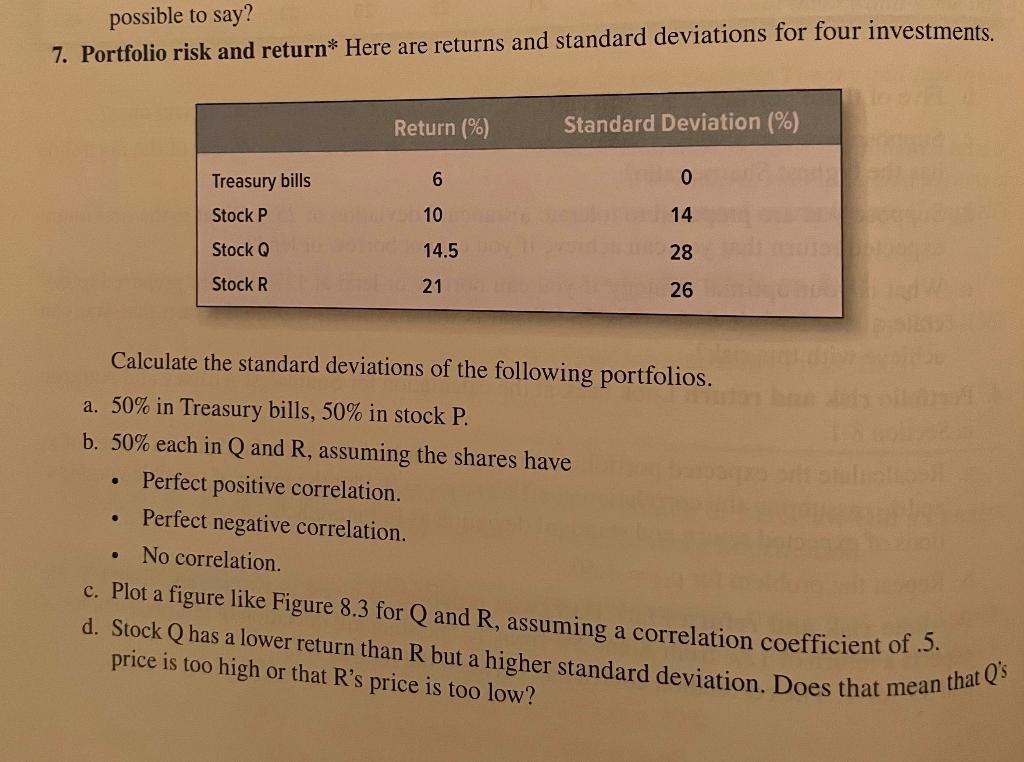
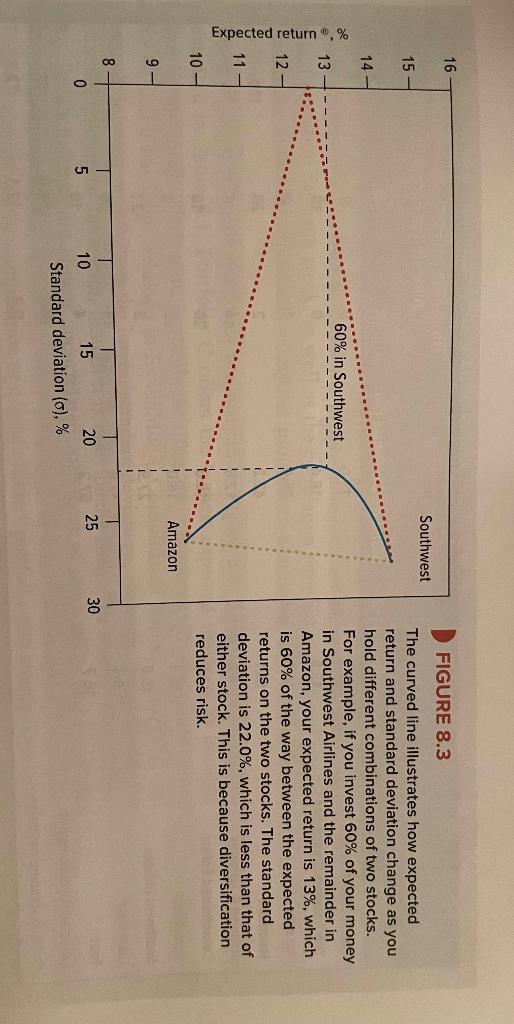
possible to say? 7. Portfolio risk and return* Here are returns and standard deviations for four investments. Calculate the standard deviations of the following portfolios. a. 50% in Treasury bills, 50% in stock P. b. 50% each in Q and R, assuming the shares have - Perfect positive correlation. - Perfect negative correlation. - No correlation. c. Plot a figure like Figure 8.3 for Q and R, assuming a correlation coefficient of .5. d. Stock Q has a lower return than R but a higher standard deviation. Does that mean that Q price is too high or that R's price is too low? FIGURE 8.3 The curved line illustrates how expected return and standard deviation change as you hold different combinations of two stocks. For example, if you invest 60% of your money in Southwest Airlines and the remainder in Amazon, your expected return is 13%, which is 60% of the way between the expected returns on the two stocks. The standard deviation is 22.0%, which is less than that of either stock. This is because diversification reduces risk
Step by Step Solution
There are 3 Steps involved in it

Get step-by-step solutions from verified subject matter experts