

Question: Please present the plotting results and data. and fill in the blanks. 4. Profit maximization and loss minimization BYOB is a monopolist in beer production
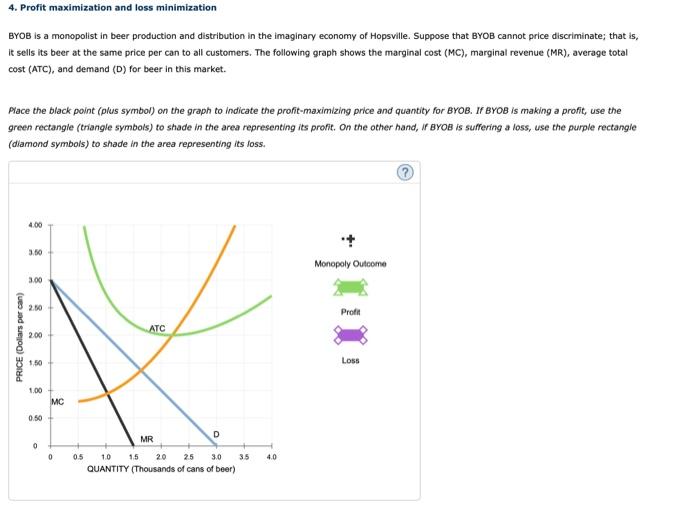
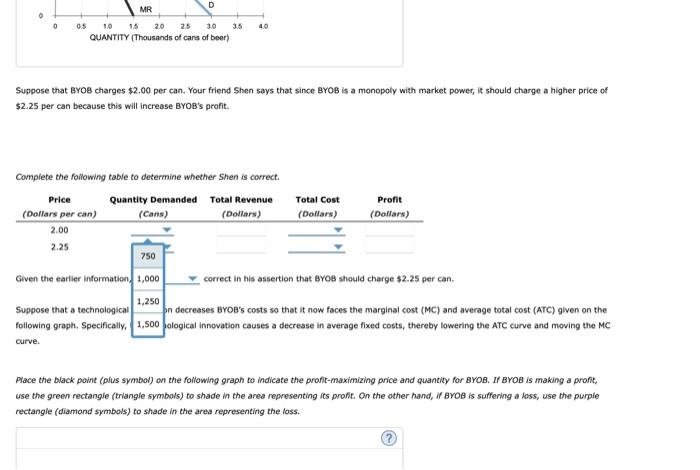
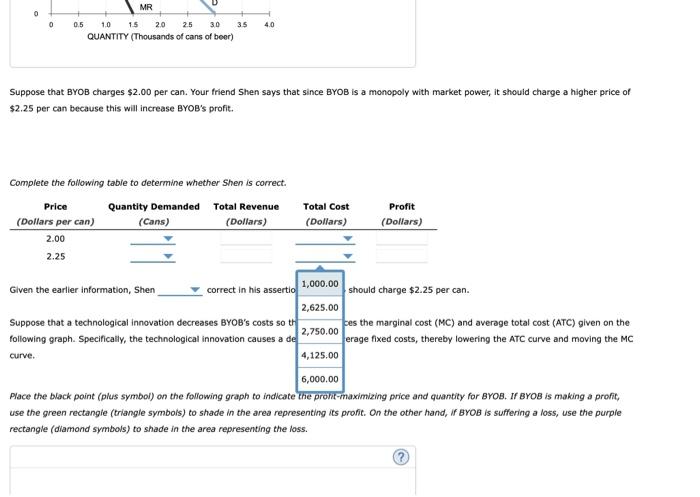
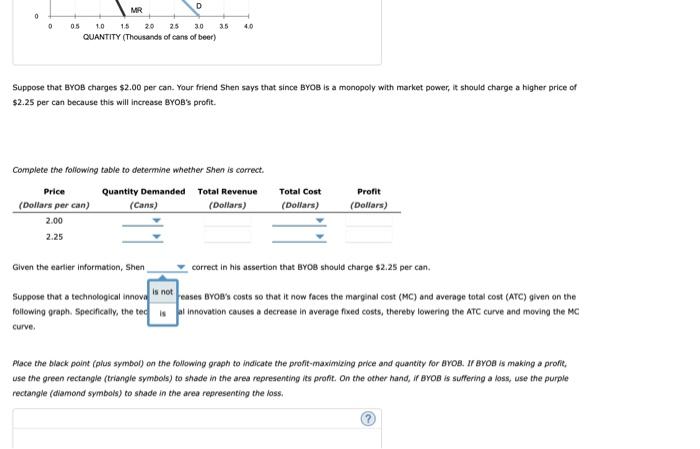
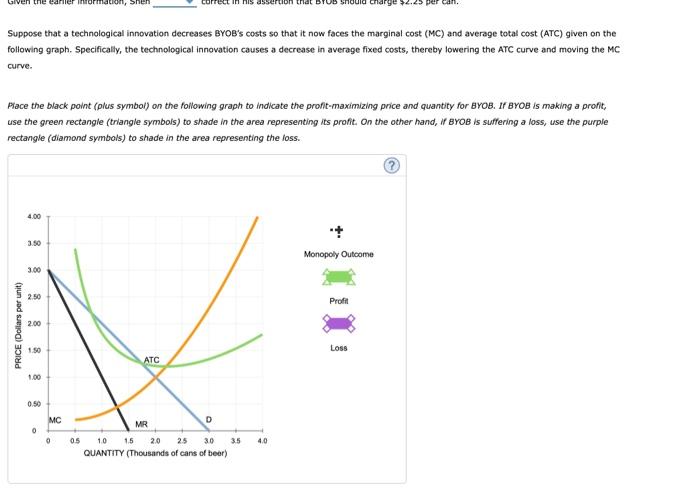
4. Profit maximization and loss minimization BYOB is a monopolist in beer production and distribution in the imaginary economy of Hopsville. Suppose that BYOB cannot price discriminate; that is, it sells its beer at the same price per can to all customers. The following graph shows the marginal cost (MC), marginal revenue (MR), average total cost (ATC), and demand (D) for beer in this market. Pace the black point (plus symbol) on the graph to indicate the profit-maximizing price and quantity for BYOB. If BYOB is making a profit, use the green rectangle (triangle symbols) to shade in the area representing its profit. On the other hand, if BYOB is suffering a loss, use the purple rectangle (diamond symbols) to shade in the area representing its foss. Suppose that BYOB charges $2.00 per can, Your friend Shen says that since BYOB is a monopoly with market power, it should charge a higher price of $2.25 per can because this will increase BroB's profit. Complete the following table to determine whether Shen is correct. Given the eartier information, 1,000 Suppose that a technological following graph. Specifically, curve. Place the black point (plus symbol) on the following graph to indicate the profit-maximizing price and quantity for BYoB. If BYoB is making a pront, use the green rectangle (triangle symbols) to shade in the area representing its profit. On the other hand, if Brob is suffering a loss, use the purpie rectangle (diamond symbols) to shade in the area representing the loss. Suppose that BYOB charges $2.00 per can. Your friend Shen says that since Bros is a monopoly with market power, it should charge a higher price of $2.25 per can because this will increase BYOB's profit. Complete the following table to determine whether Shen is correct. Given the eartier information, shen correct in his assertion that BYoB should charge $2.25 per can. Suppose that a technological innovi_ eases BYoB's costs so that it now faces the marginal cost (MC) and average total cost (ATC) given on the following graph. Specifically, the tec_ Il innovation causes a decrease in average fixed costs, thereby lowering the ATC curve and moving the MC curve. Place the black paint (pius symbol) on the following graph to indicate the profit-maximizing price and quantity for uros. If bros is making a profit, use the green rectangle (triangle symbols) to shade in the area representing its proft. On the other hand, if ByOB is suffering a lass, use the purple rectangle (diamond symbois) to shade in the area representing the loss. Suppose that a technological innovation decreases BYOB's costs so that it now faces the marginal cost (MC) and average total cost (ATC) given on the following graph. Specifically, the technological innovation causes a decrease in average fixed costs, thereby lowering the ATC curve and moving the MC curve. Pace the black point (plus symbol) on the following graph to indicate the profit-maximizing price and quantity for BroB. If BYOB is making a profit, use the green rectangle (triangle symbols) to shade in the area representing its profit. On the other hand, if BYoB is suffering a loss, use the purple rectangle (diamond symbols) to shade in the area representing the loss
Step by Step Solution
There are 3 Steps involved in it

Get step-by-step solutions from verified subject matter experts