

Question: please prove the Matlab code as well thanks Matlab is necessary The s represent that H(s) is the Fourier transform of h(t). 1.4 Consider the
please prove the Matlab code as well thanks
Matlab is necessary
The "s" represent that H(s) is the Fourier transform of h(t).
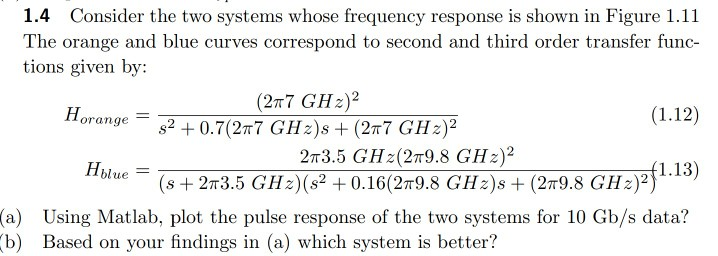
1.4 Consider the two systems whose frequency response is shown in Figure 1.11 The orange and blue curves correspond to second and third order transfer func- tions given by: (277 GHz) Horange = 52 +0.7(277 GHz)s +(267 GH2)2 (1.12) 273.5 GHz(279.8 GHz)2 (s + 213.5 GHz) (s2 + 0.16(29.8 GHz)s + (279.8 G (a) Using Matlab, plot the pulse response of the two systems for 10 Gb/s data? b) Based on your findings in (a) which system is better? 1.4 Consider the two systems whose frequency response is shown in Figure 1.11 The orange and blue curves correspond to second and third order transfer func- tions given by: (277 GHz) Horange = 52 +0.7(277 GHz)s +(267 GH2)2 (1.12) 273.5 GHz(279.8 GHz)2 (s + 213.5 GHz) (s2 + 0.16(29.8 GHz)s + (279.8 G (a) Using Matlab, plot the pulse response of the two systems for 10 Gb/s data? b) Based on your findings in (a) which system is better
Step by Step Solution
There are 3 Steps involved in it

Get step-by-step solutions from verified subject matter experts